Web Manager - Remote Building Management
The Web Manager as a tool for managing, visualizing, and interacting with building automation data through a web-based interface. It allows users to access and control building systems remotely, configure settings, create custom visualizations, manage alarms, and integrate various building protocols. It’s particularly useful for monitoring building performance, optimizing operations, and ensuring efficient facility management.

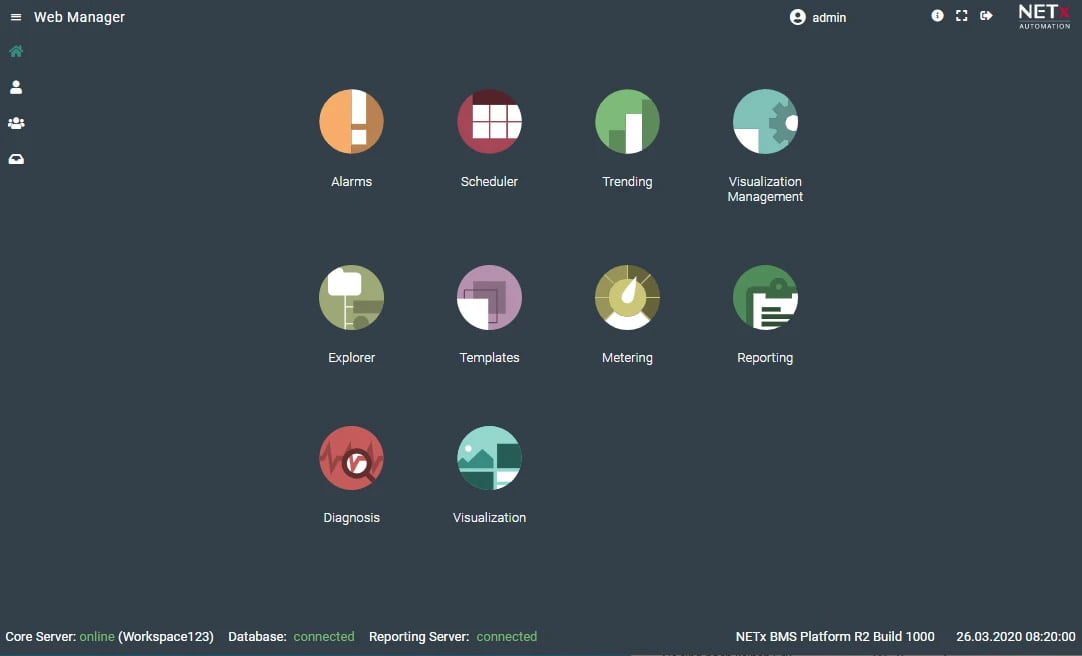
Dashboard
User interface for managing the BMS functions
The dashboard is the user interface of the Web Manager. It offers quick access to key features like alarms, scheduling, and visualization, streamlining building automation management.
Applications of the Web Manager
Alarms
Alarm Management
Scheduler
Event Coordination
Explorer
Master App
Metering
Energy Data Management
Trending
Trend Analysis
Reporting
Report Management
VisuManager
Visualization Management
Diagnosis
System Monitoring
Templates
BMS Templates
Shutter Control
Shading System
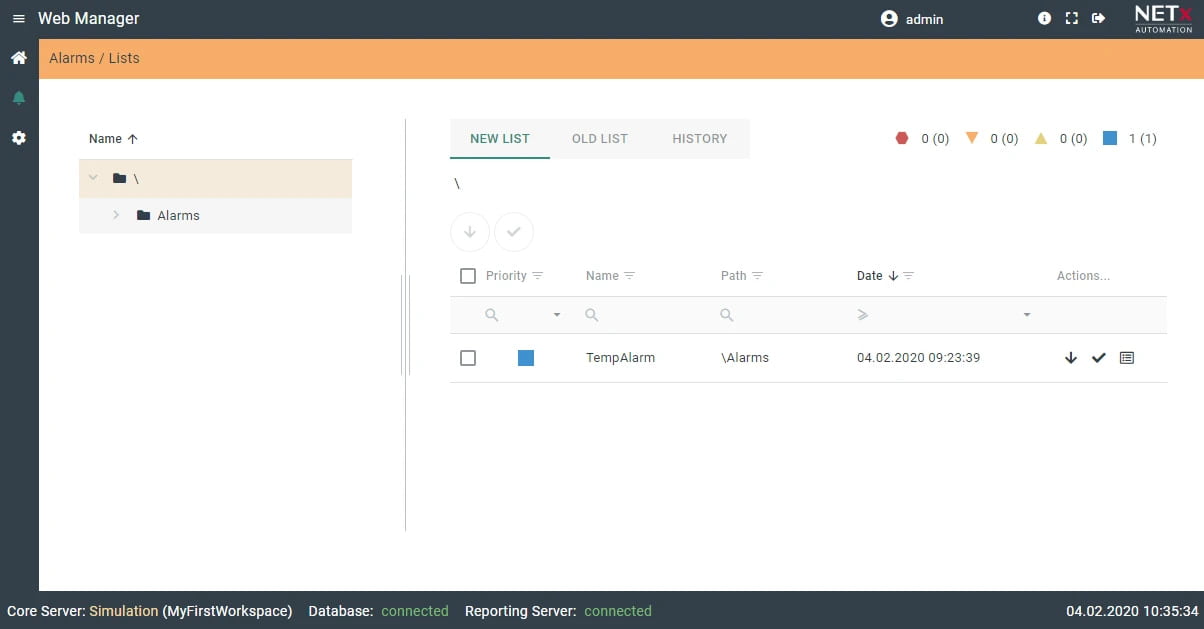
Alarms
Create and manage alarms, set conditions, and configure actions. Monitor all alarm statuses—new, active, and historical—at a glance. Alarms are displayed according to the VDI/VDE 3699 standard for consistent and clear representation.
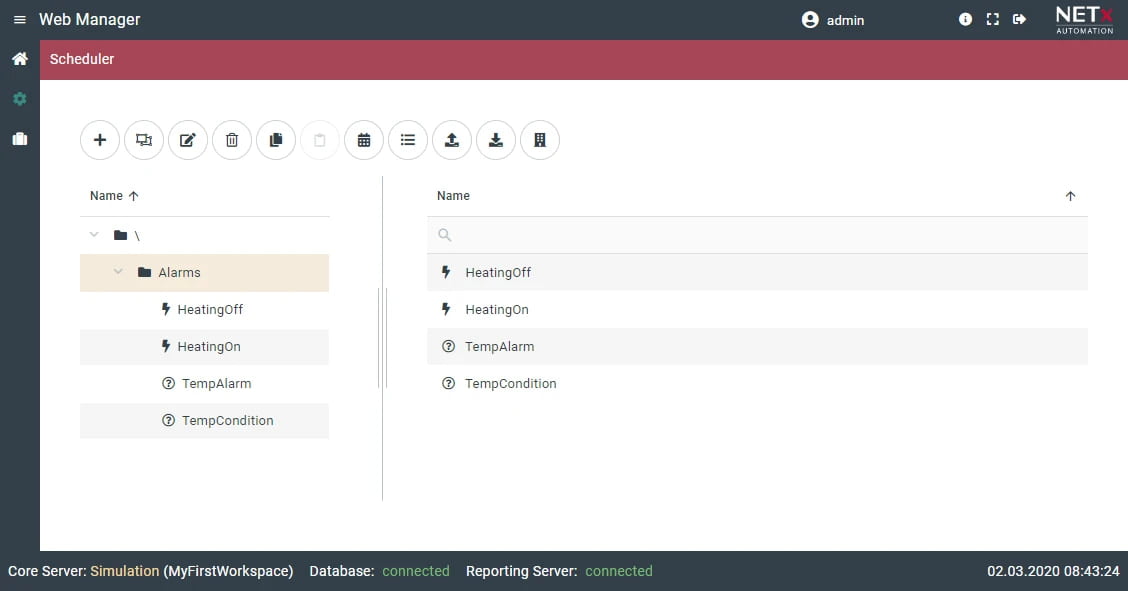
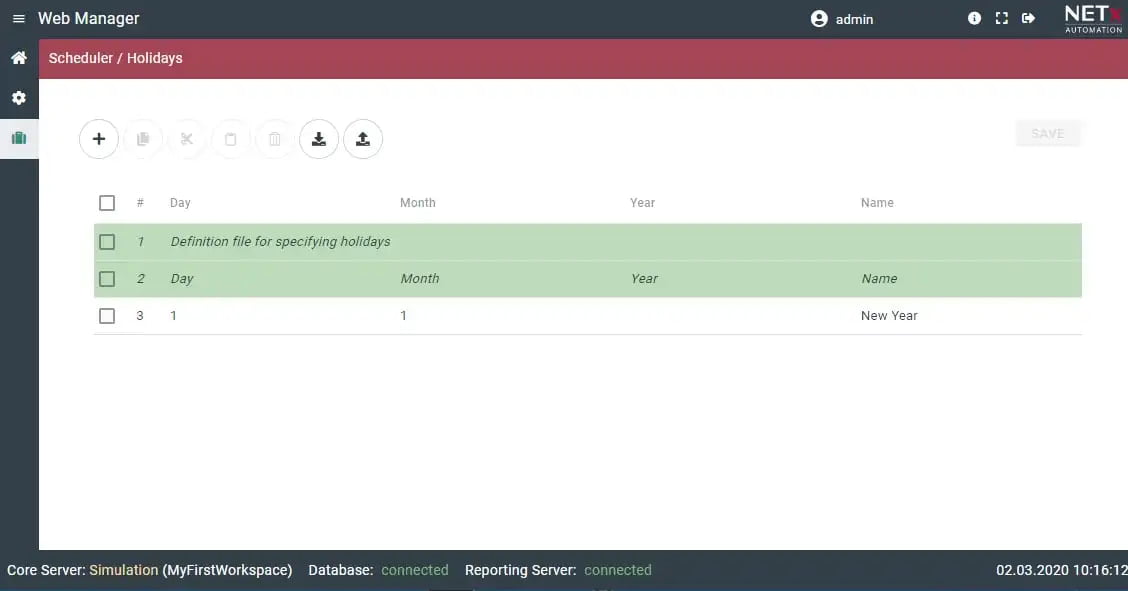
Scheduler
Define time-based events like timers, start-stop sequences, or cyclical events, as well as conditional events that trigger specific actions. Easily manage all events with a list view for quick reference and a calendar view for an intuitive overview of time-based activities.
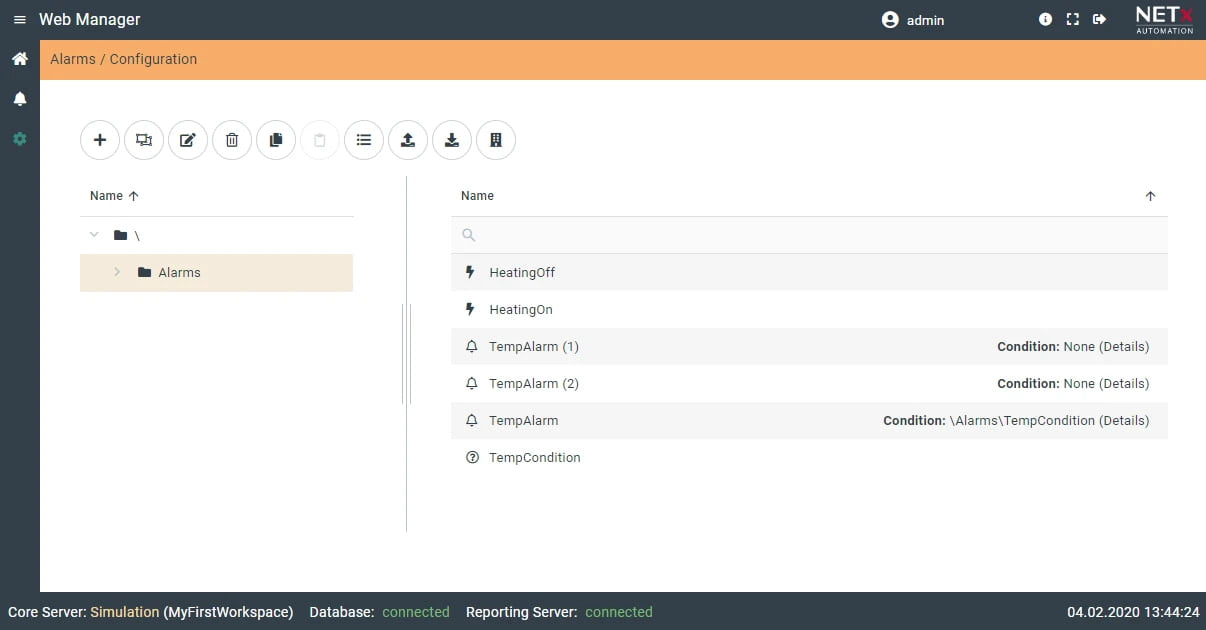
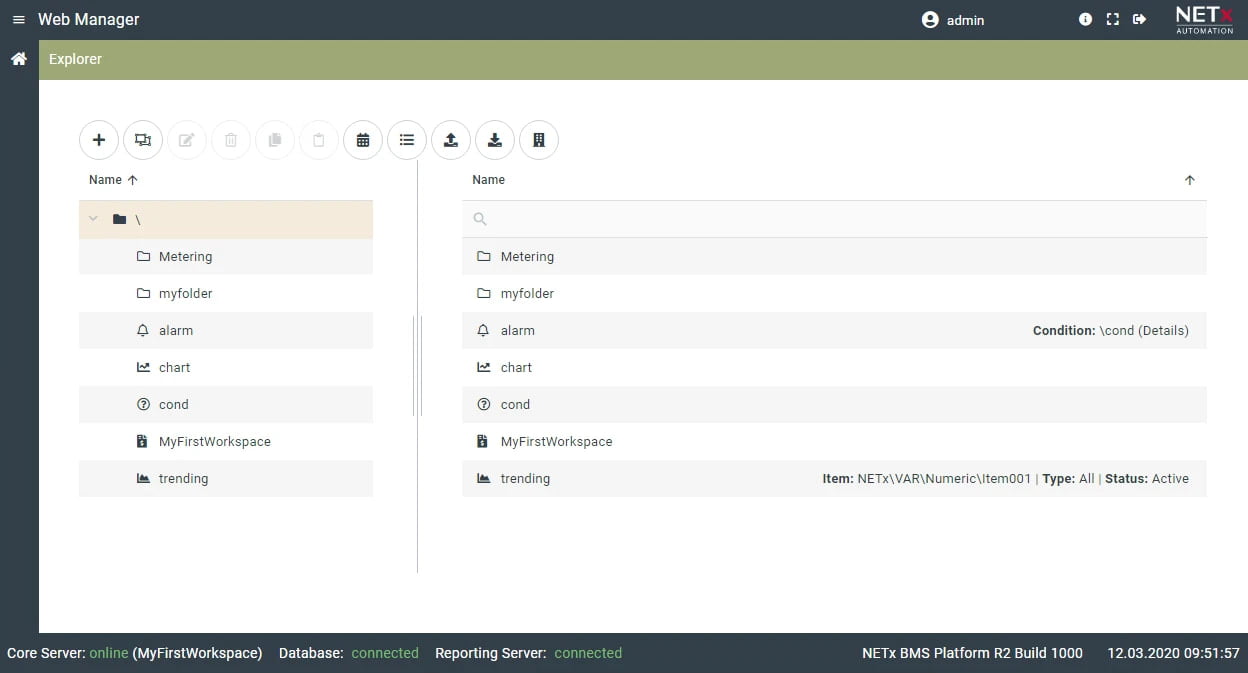
Explorer
Master app combines the functionality of all other apps. Configure all available events, such as alarms, time-based actions, conditions, and more. Includes an export/import feature for easy data management.
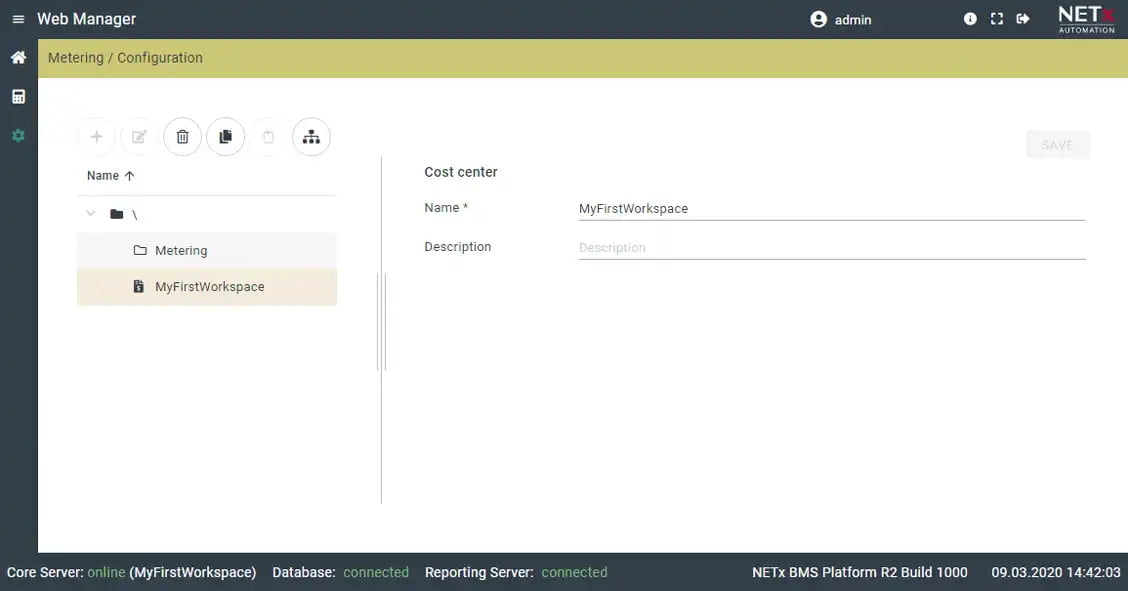
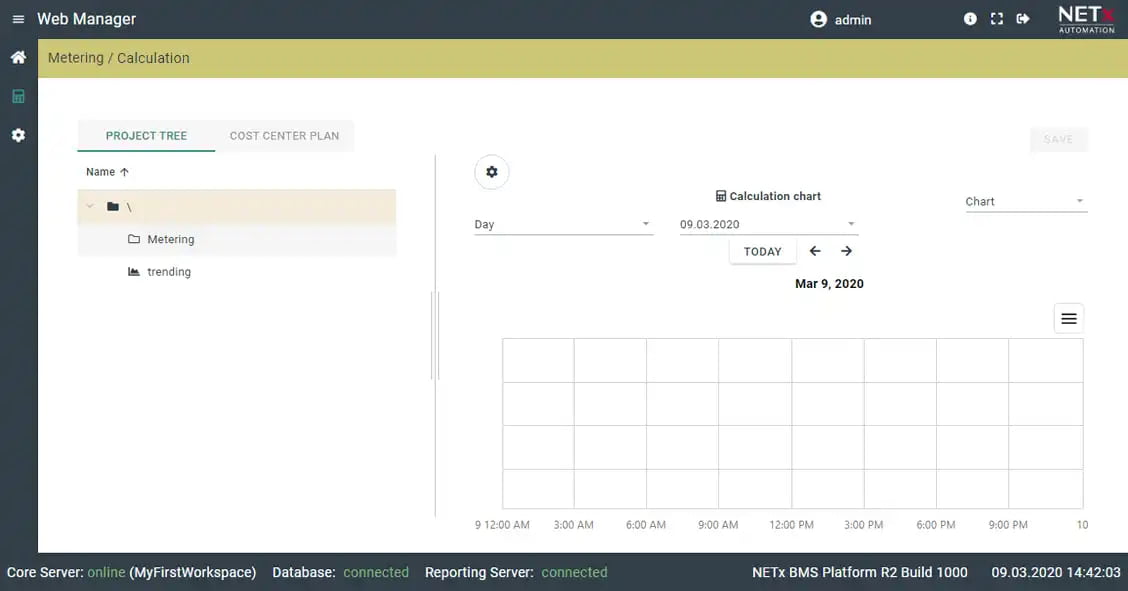
Metering
Unified data monitoring, analysis, and processing from smart meters.
Manufacturer- and type independent
Only included in connection with the NETx Metering Module / BMS Platform
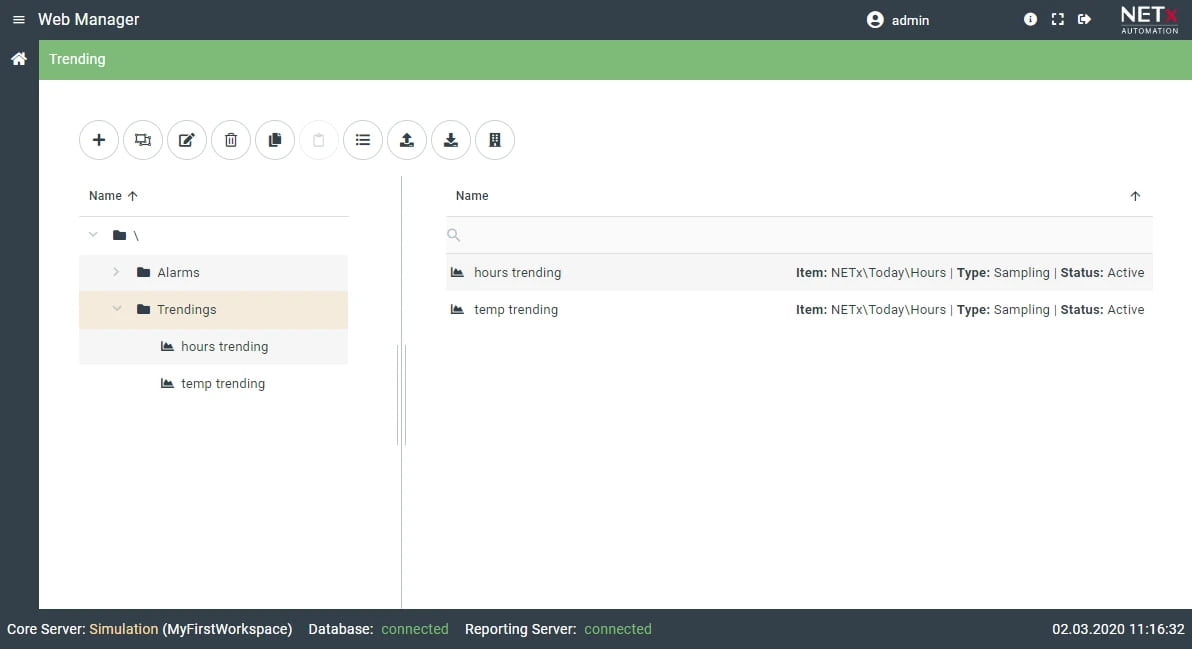
Trending
Create and manage trends by recording historical data point values from an SQL database. Supports various storage methods like change-of-value (COV) and sampling. Visualize data in diagrams or tables, with the ability to combine multiple trends or periods into a single view for detailed analysis.
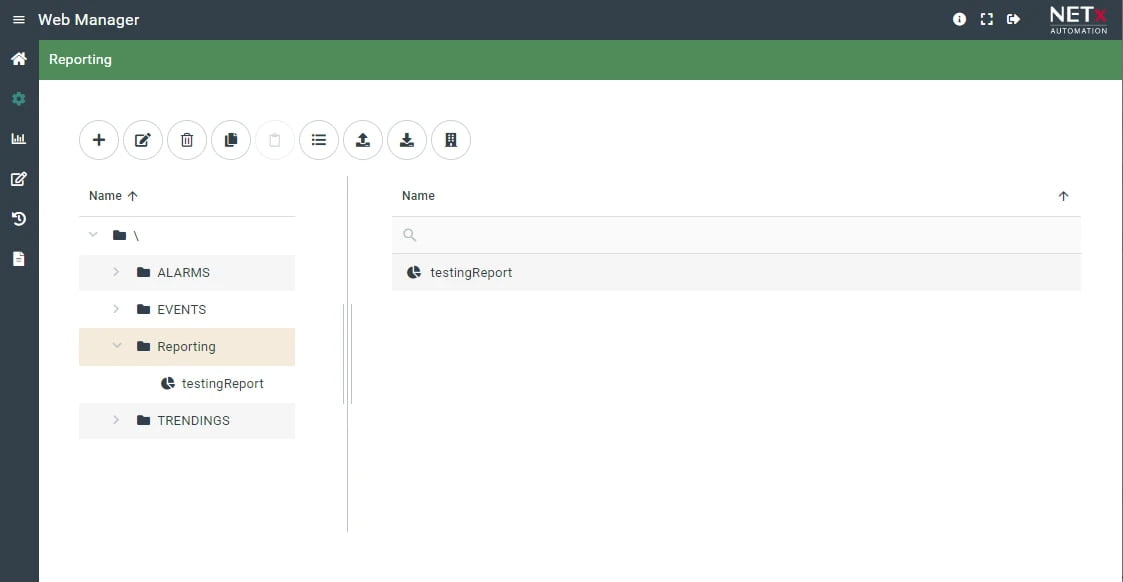
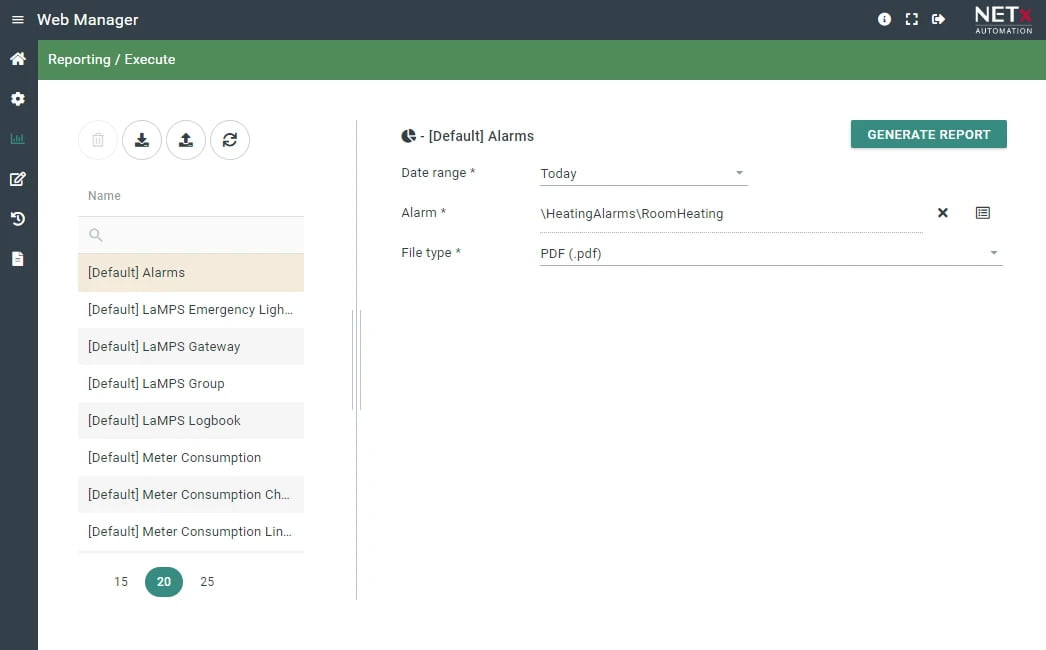
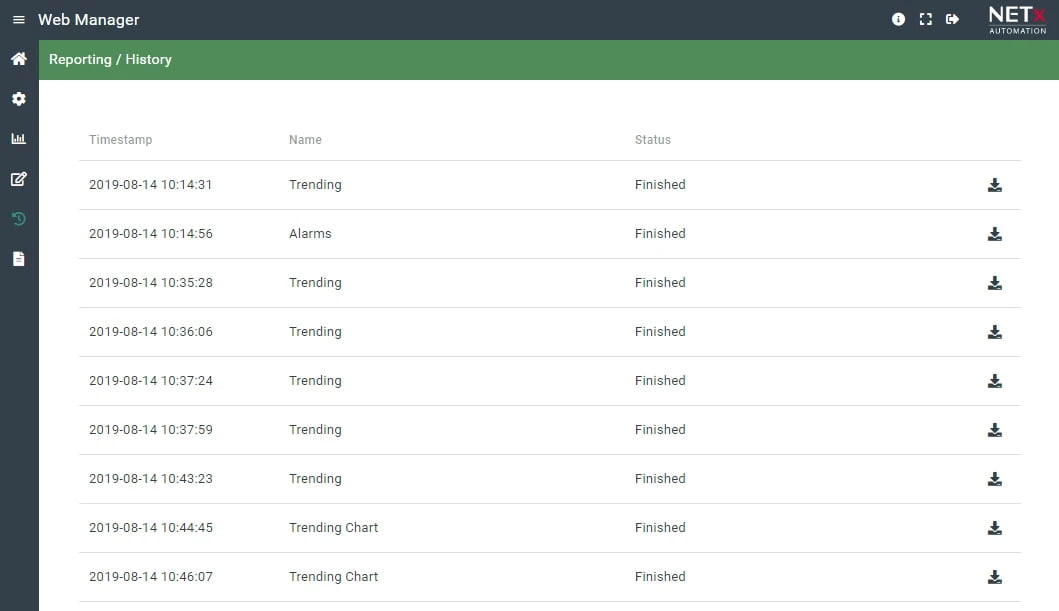
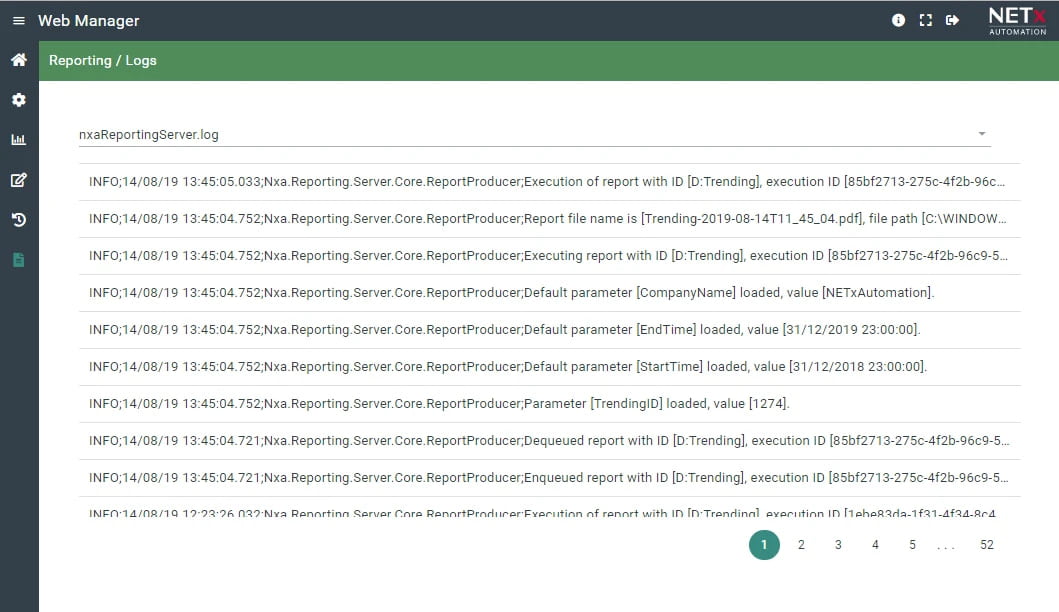
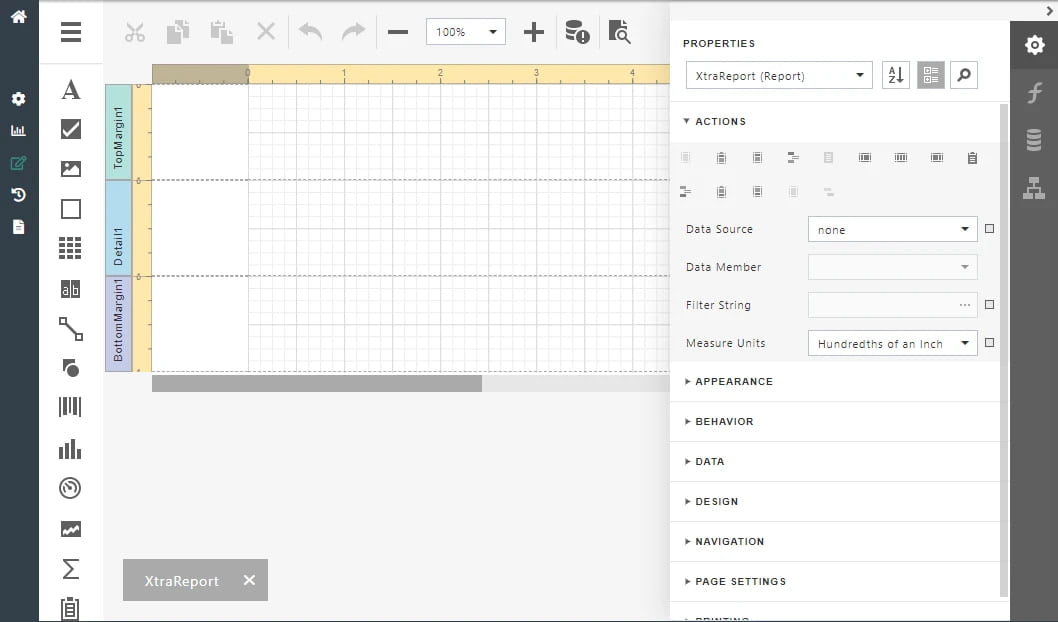
Reporting
Efficient management of trend and historical data reports with predefined templates for alarms, trends, and DALI test results. Supports automated report generation and includes a designer for custom templates and layouts.
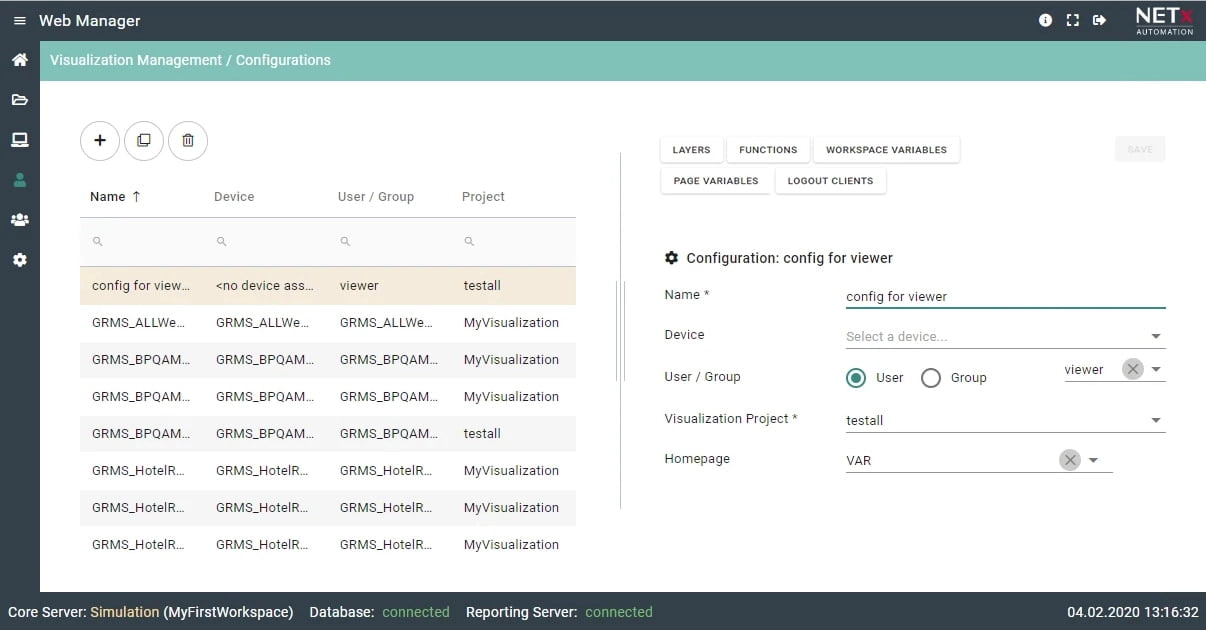
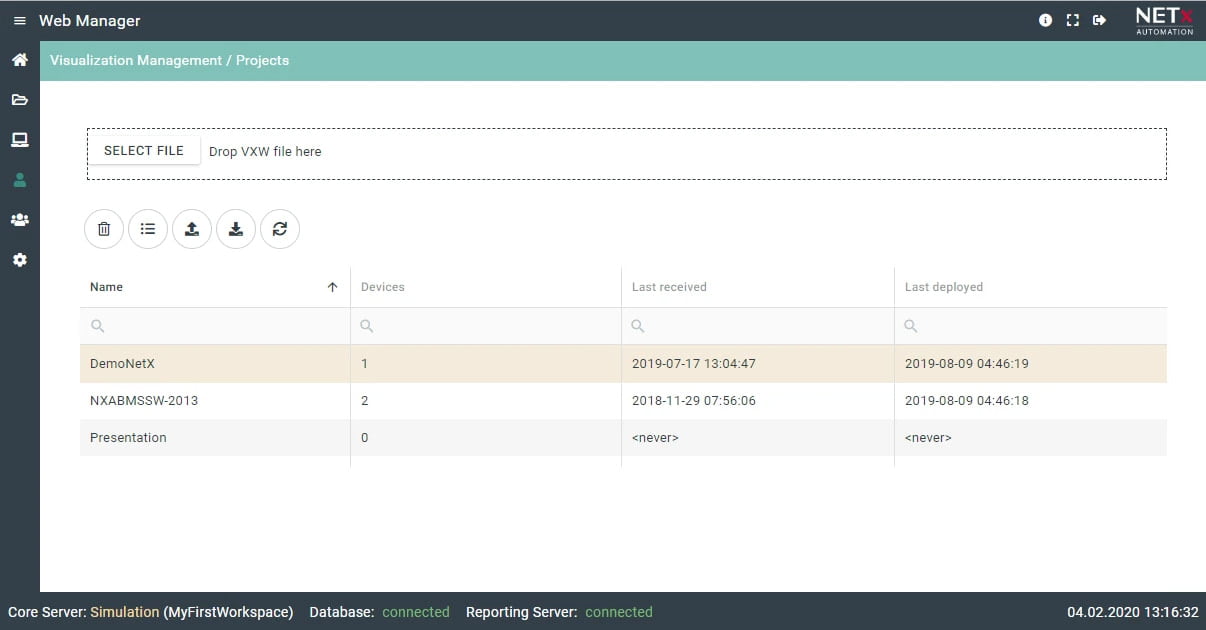
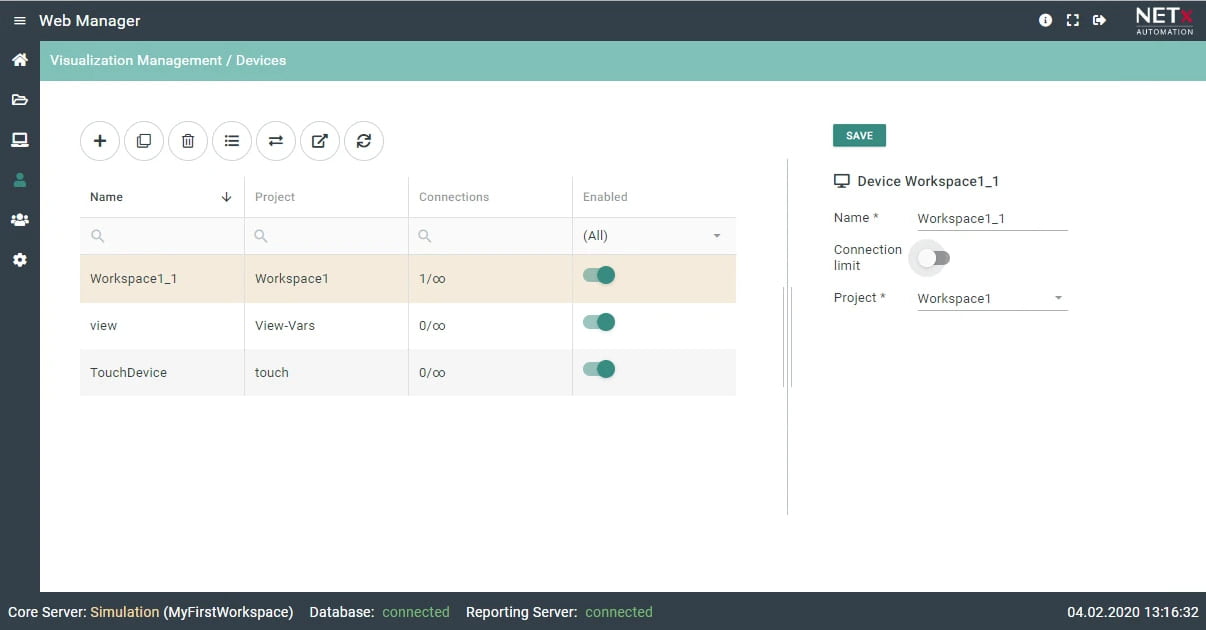
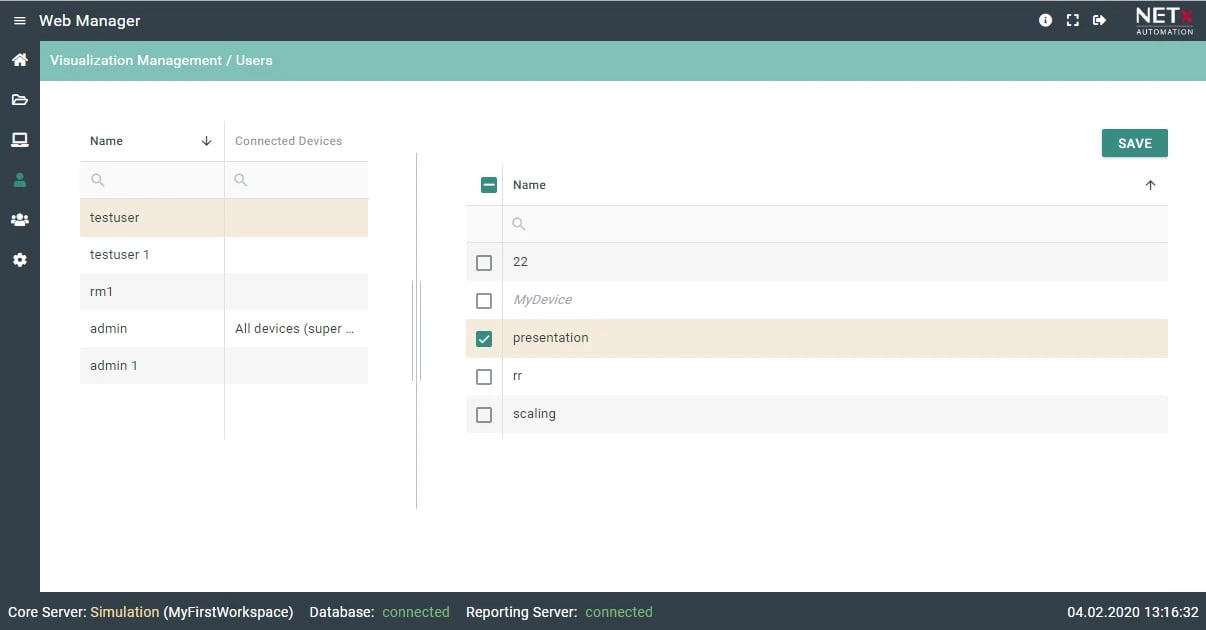
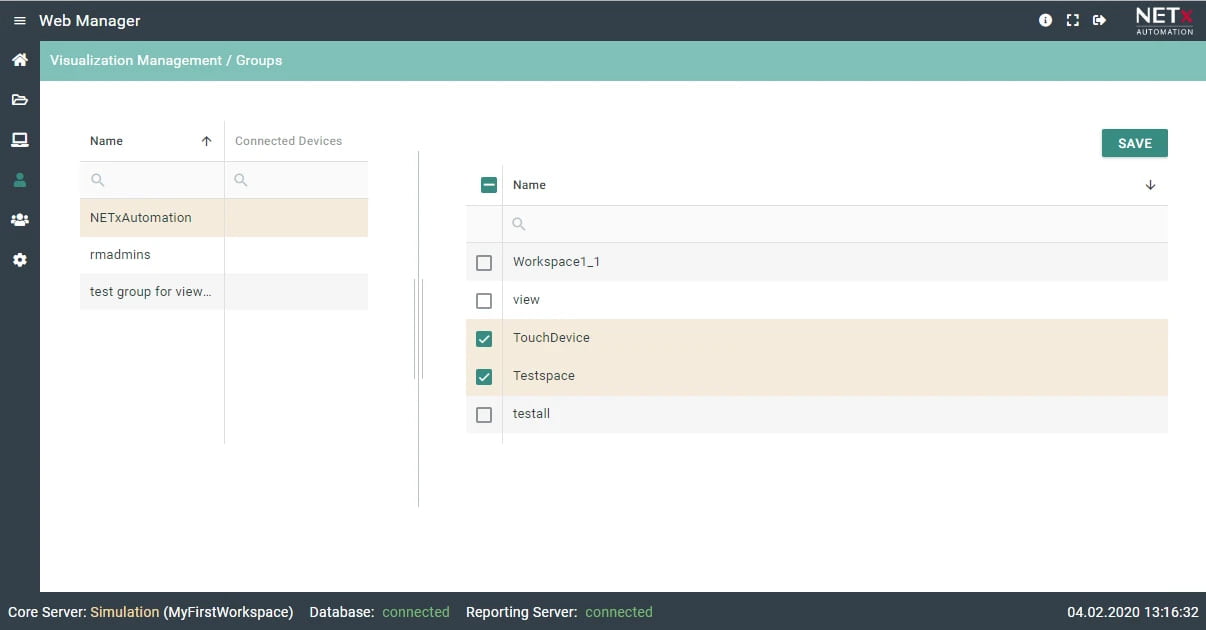
Visualzation Manager
Manage visualization projects and users, configure and monitor devices and connections, and set up visualization preferences and user access rights, ensuring streamlined project oversight and controlled access.
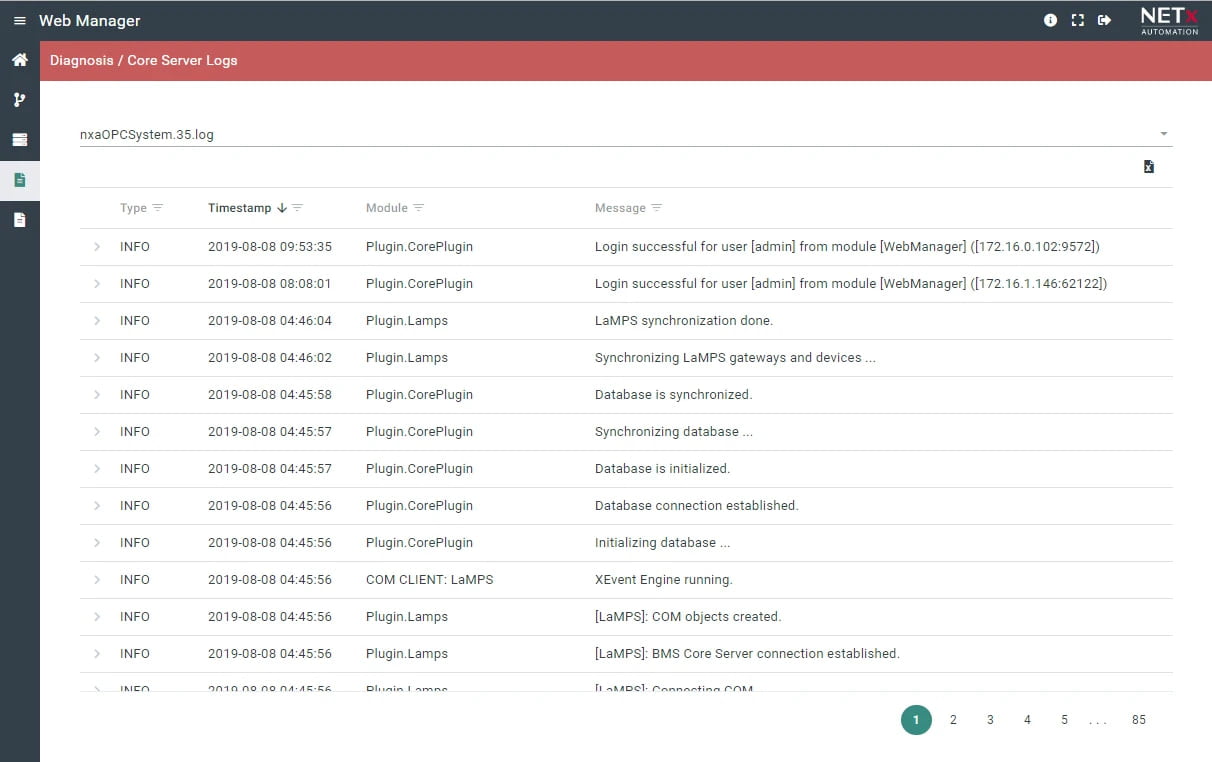
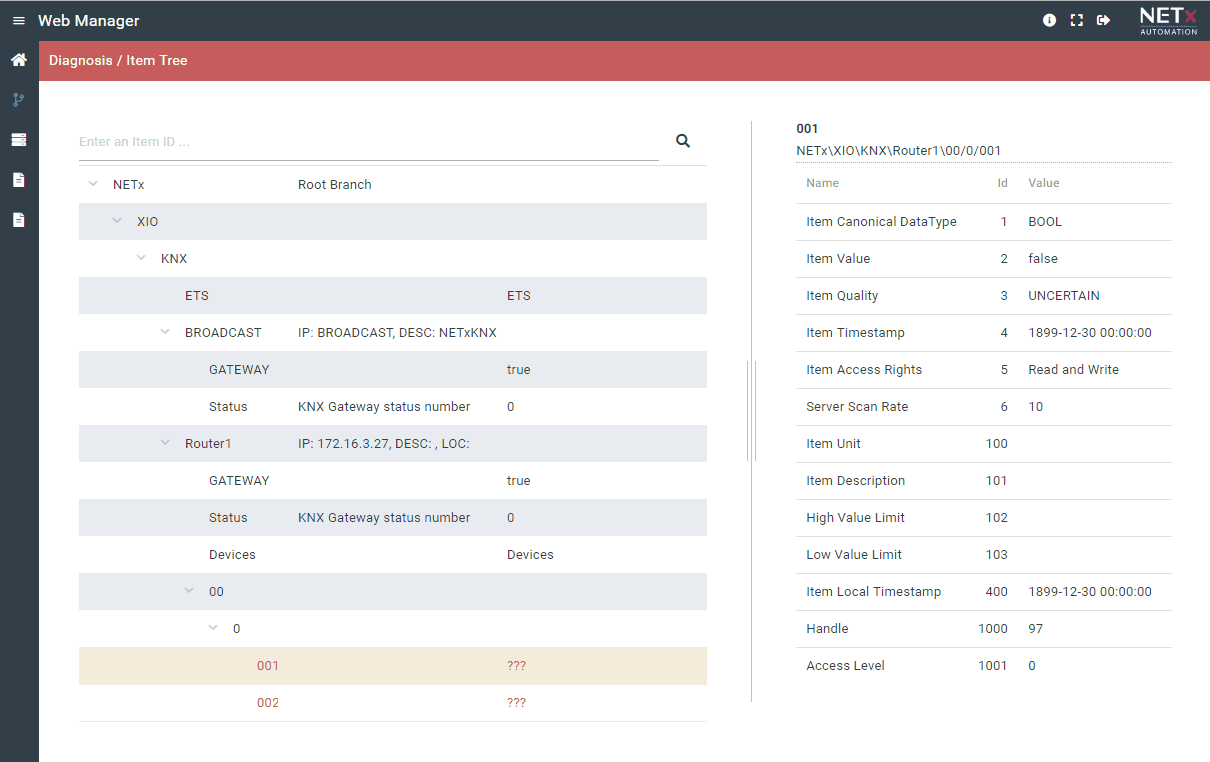
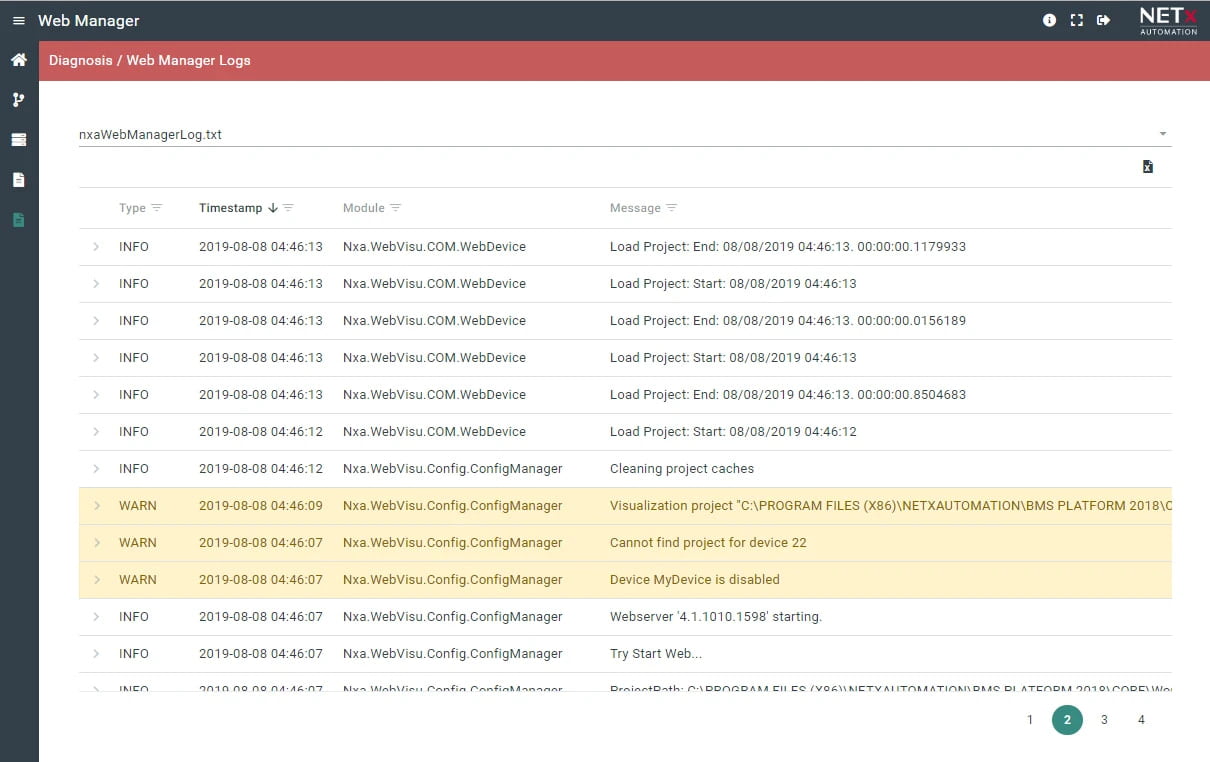
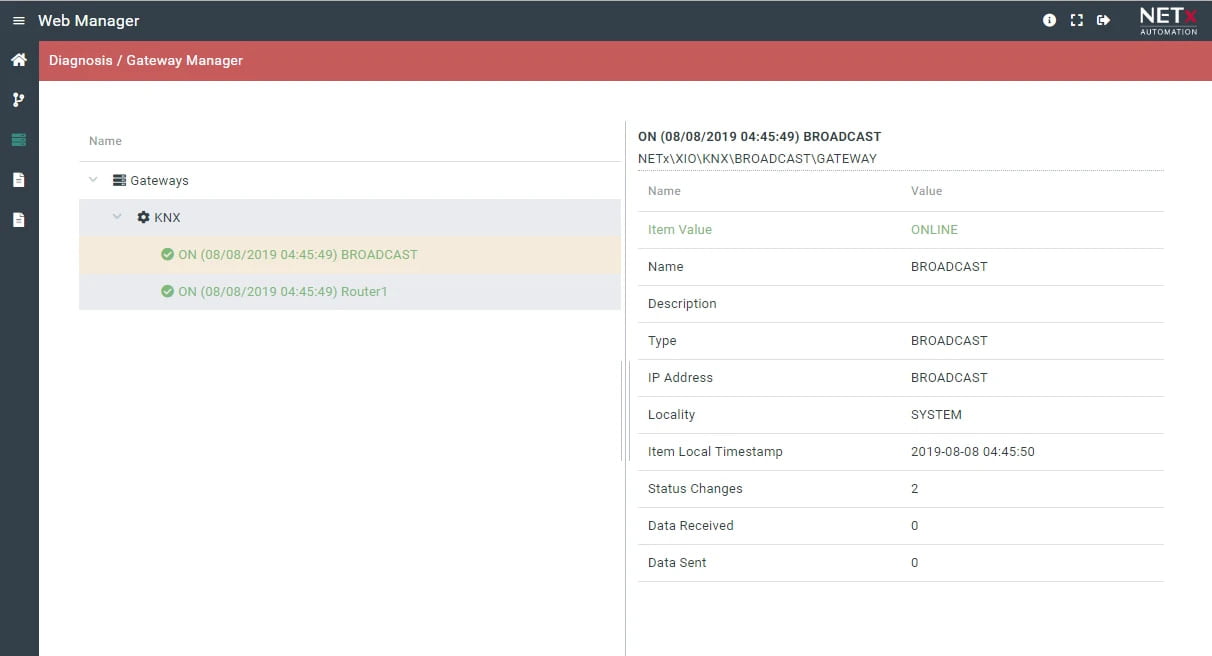
Diagnosis
Monitors system behavior, views connection status of routers and interfaces, and creates protocols for system analysis.
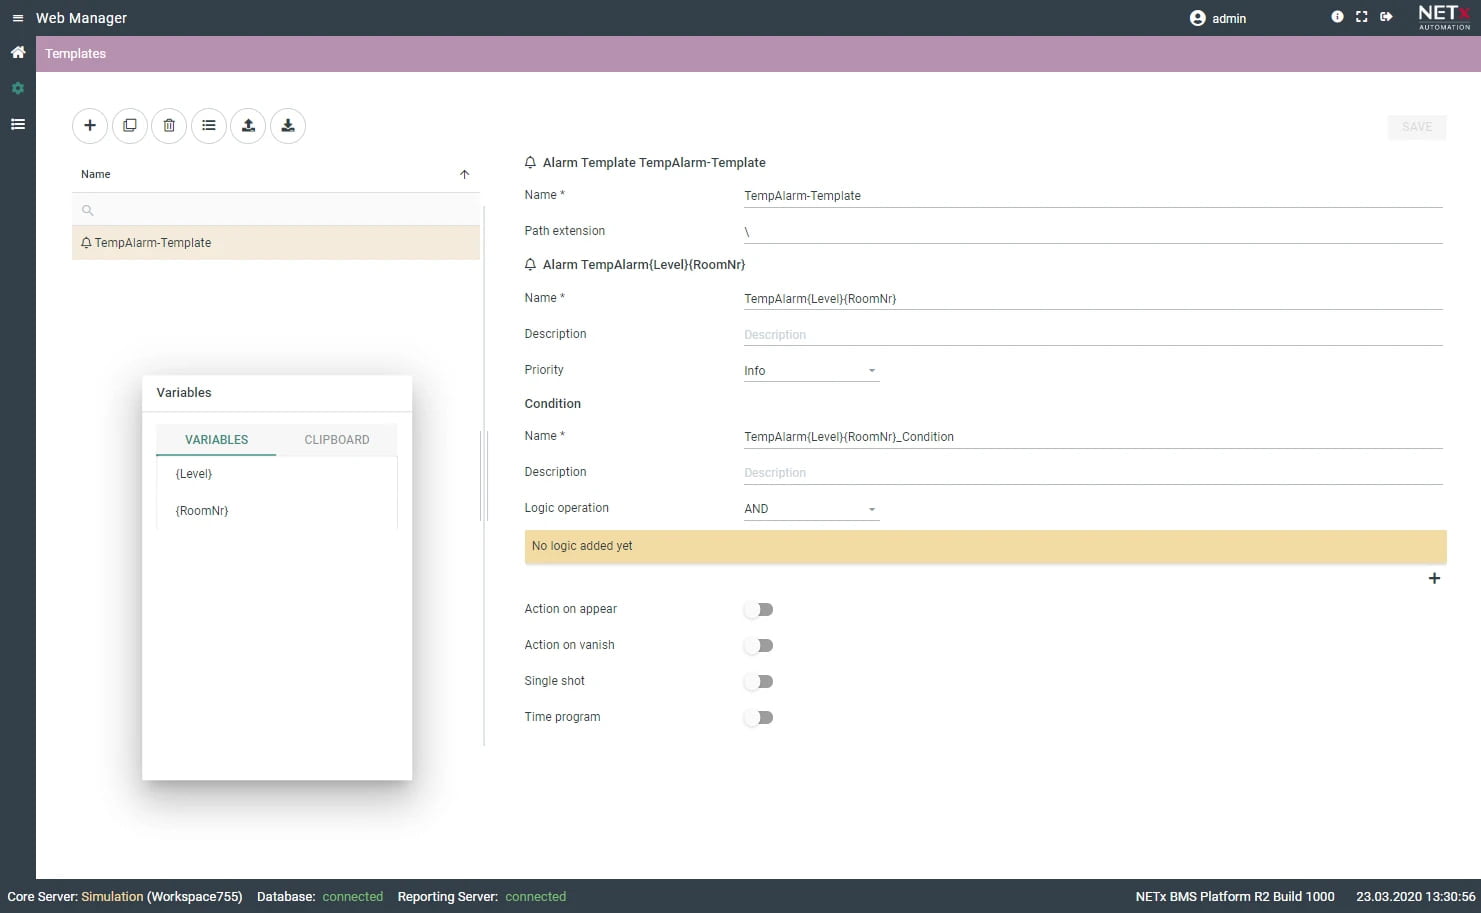
Templates
Provides templates for implementing BMS functions in large-scale building automation, allowing data import via Excel and enabling quick creation of alarms, events, and trends with minimal effort.
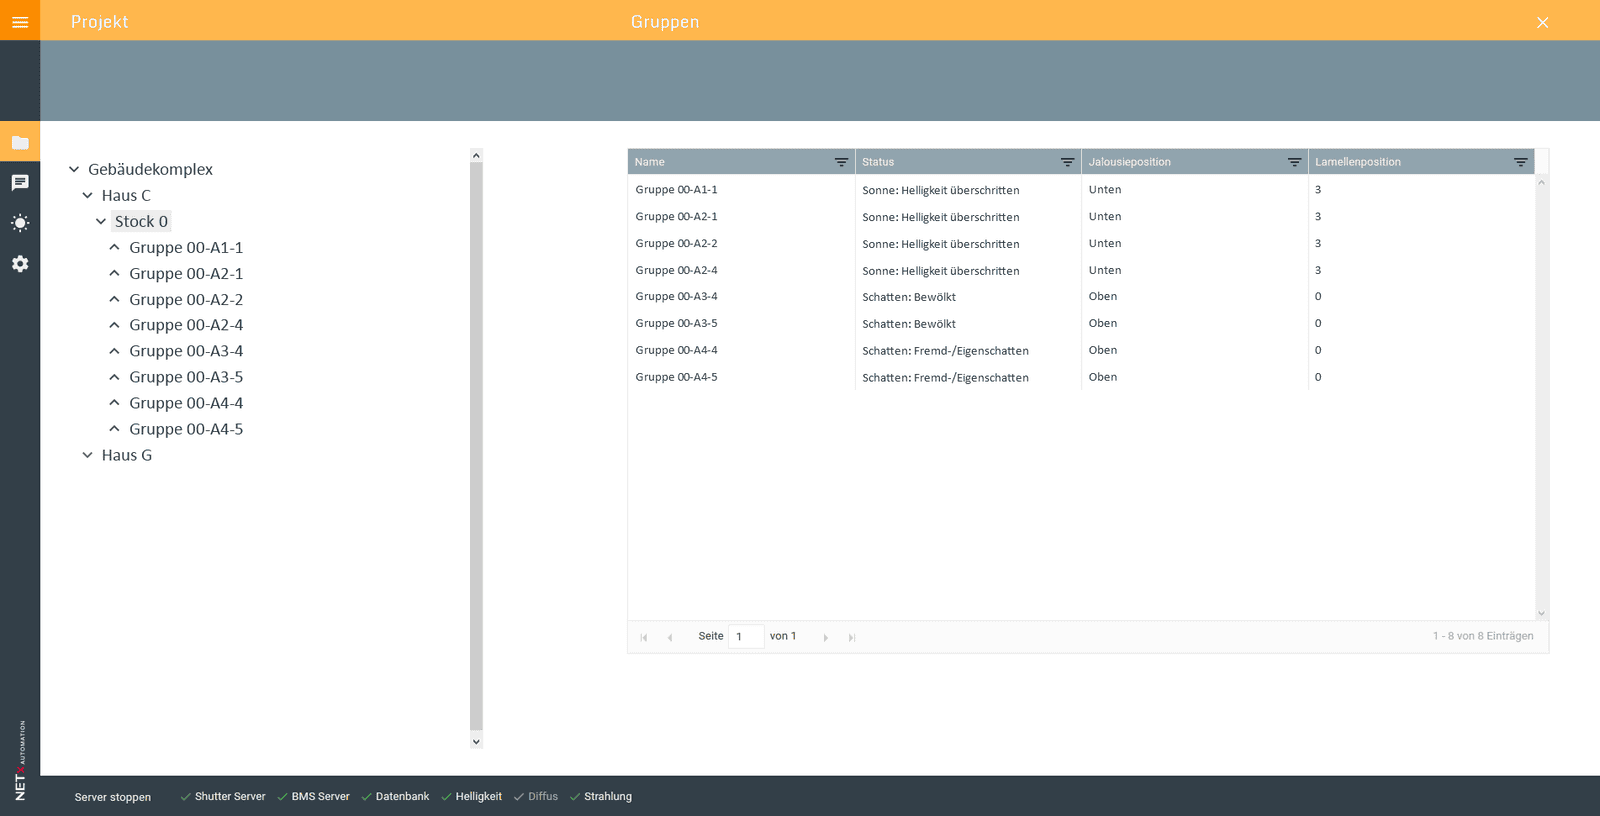
Shutter Control
Automated shading for complex buildings considers season, weather, sun position, and building geometry, ideal for centrally managing thousands of blinds in large buildings.
Only included in connection with the NETx Shutter Control Module / BMS Platform
Technical Details
User interface for managing the BMS functions
- Apps are started and users, groups and access rights managed via the dashboard
- Can be accessed from any client with a web browser
- TLS-secured HTTPS authentication and user authentication
- Available apps: Alarms, Scheduler, Trending, Visualization Manager, Reporting, Diagnosis, Explorer, Templates, Shutter Control
- Create and manage alarms, their conditions and actions
- Overview of all alarm states: new, old, historical
- Representation according to standard VDI / VDE 3699
- Define time-based (timer, start-stop, cyclical event) and conditional (action after triggering the condition) events
- List view of all events
- Calendar view for time-based events
- Create and manage trends (past values of a data point from an SQL database)
- In addition to saving all data point changes, other storage schemes such as value change (COV), sampling, etc. are also possible
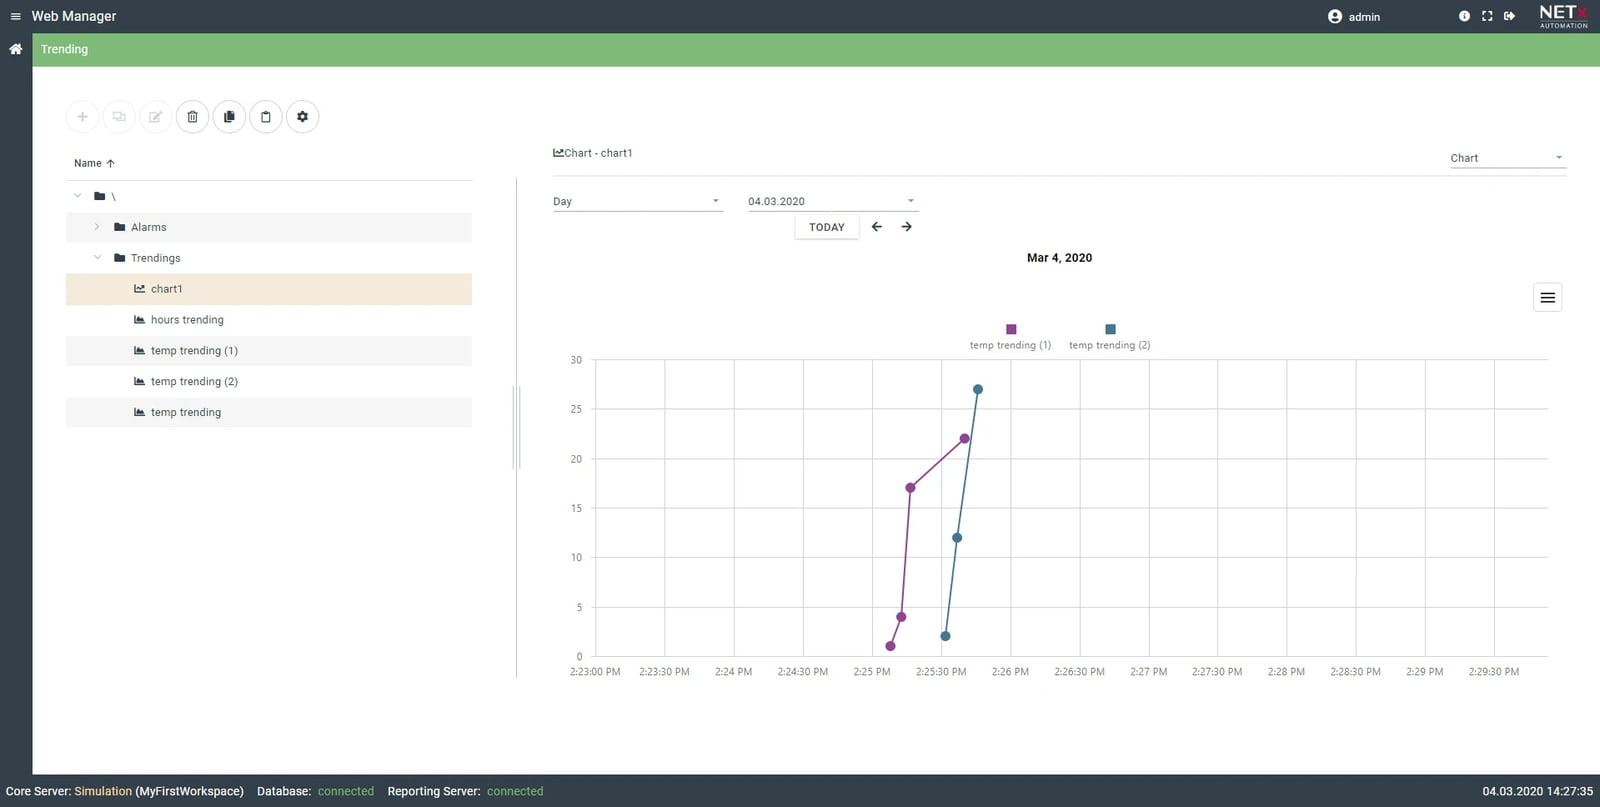
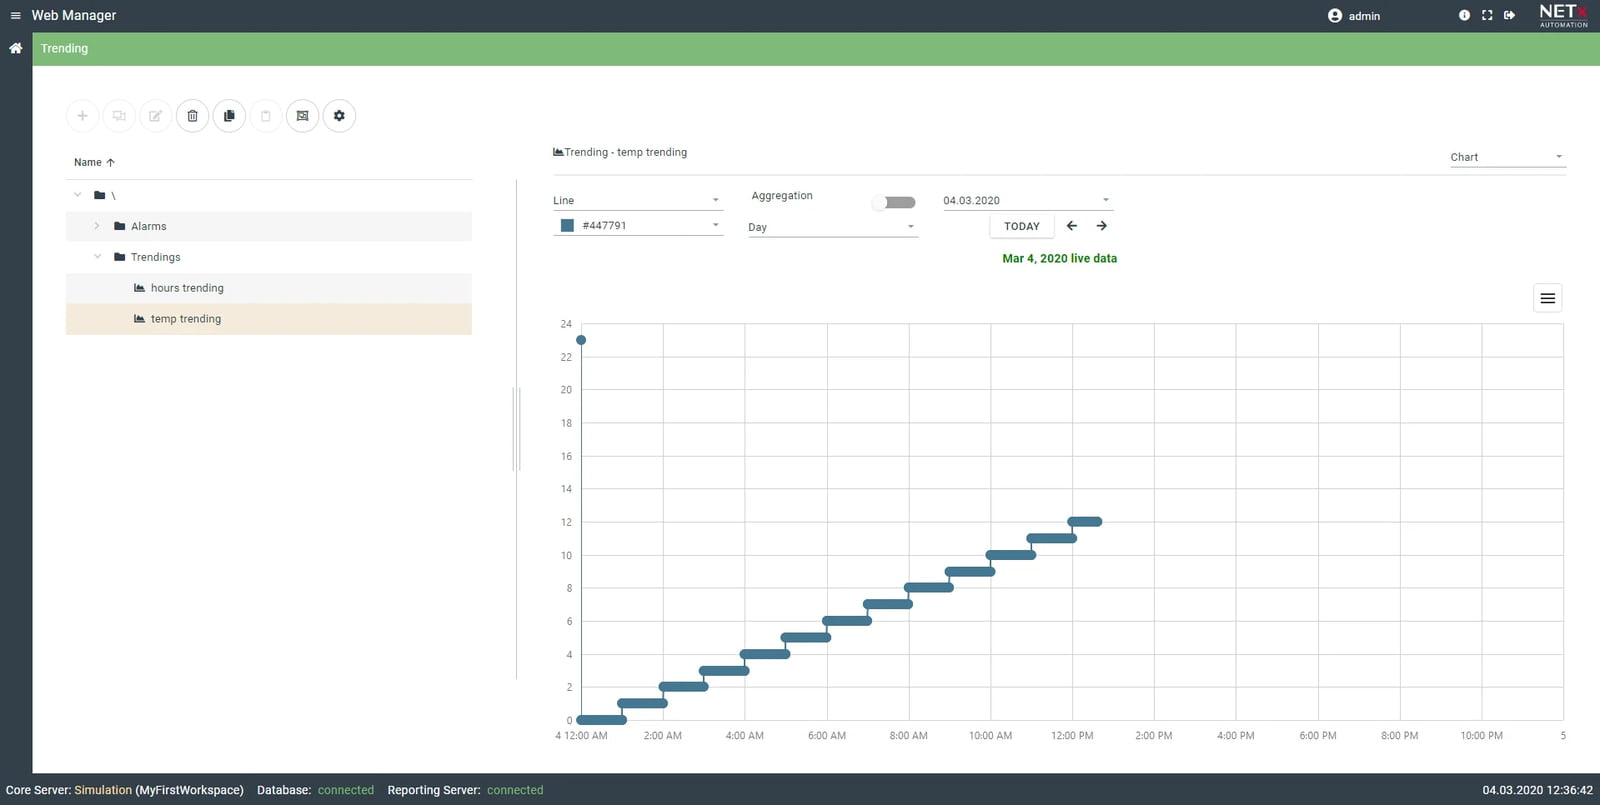
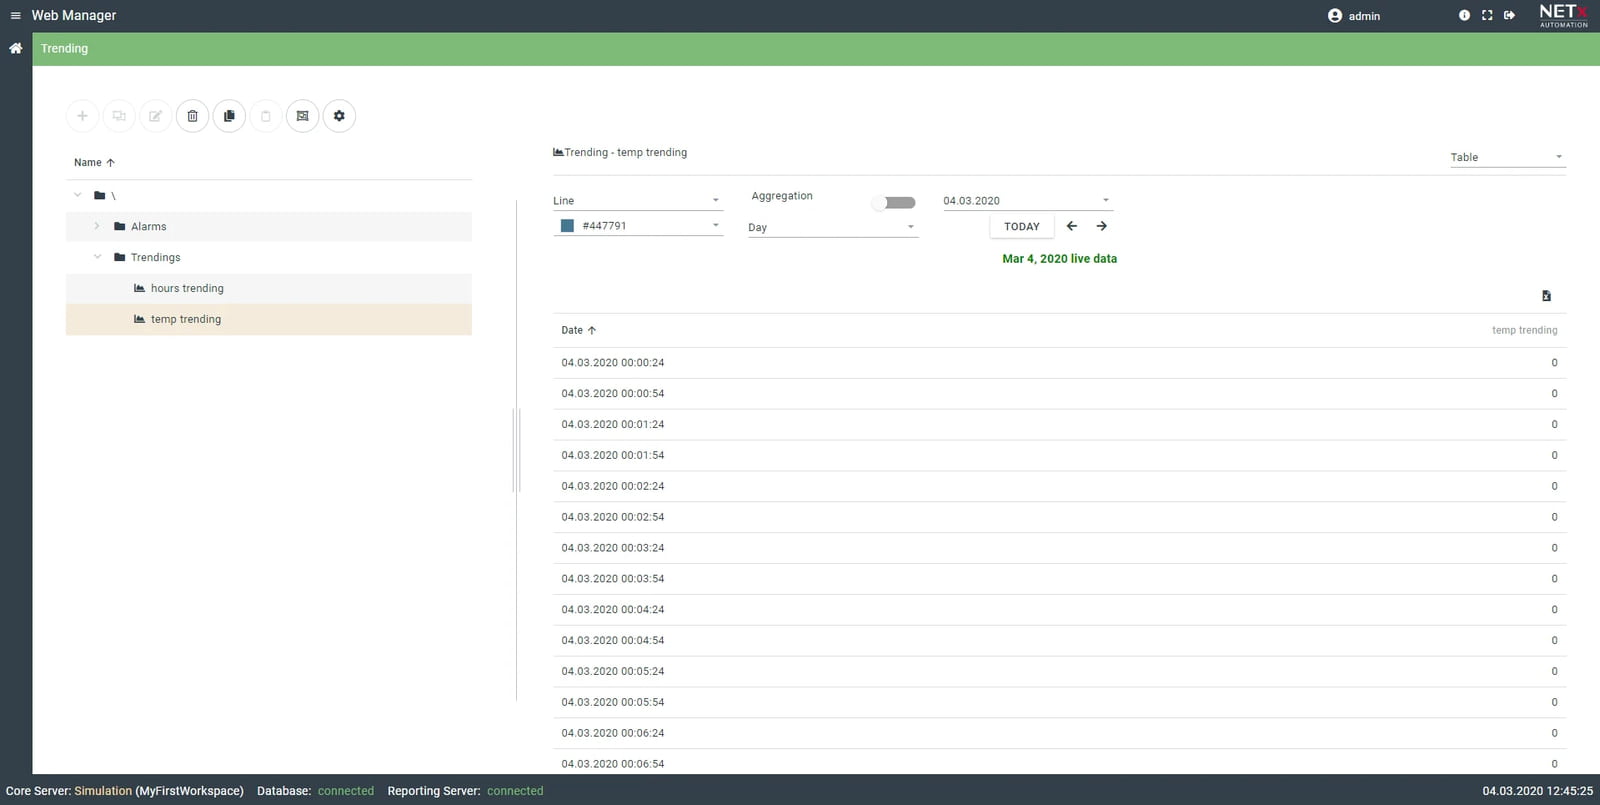
- View in diagrams and tables
- For precise analyzes, different trends or periods of a trend can be combined in one diagram
- Management of reports from trend data and historical data point values
- Predefined templates for alarm / trend reports and DALI test results
- Automatic regular report generation possible
- Includes a reporting designer for your own templates and designs
- Manage the visualization projects and users
- Configure and monitor available devices and current connections
- Define visualization configurations (e.g. how to handle alarm notifications) and user access rights
- Checks and observes the system behavior
- View the connection status of all routers and interfaces
- Creation of protocols for system analysis
- Master app that combines the functionality of all other apps
- Configure all available events (alarms, time-based events, actions, conditions, ...)
- Contains an export / import function
- Templates for the implementation of BMS functions for large building automation projects with many data points
- The required values are inserted using an Excel list
- Create thousands of alarms, time-based events, trends, etc. with just a few clicks
- Monitor, analyze and process data from smart meters
- Manufacturer- and type independent
- User interface for managing the NETx shutter control system
- Overview of all managed shutters / blinds and their statuses
- Ability to change configuration parameters such as threshold values