Manage smart meter data with the NETx Metering Module

Visualization and Usage Analysis
Visualization and Usage Analysis
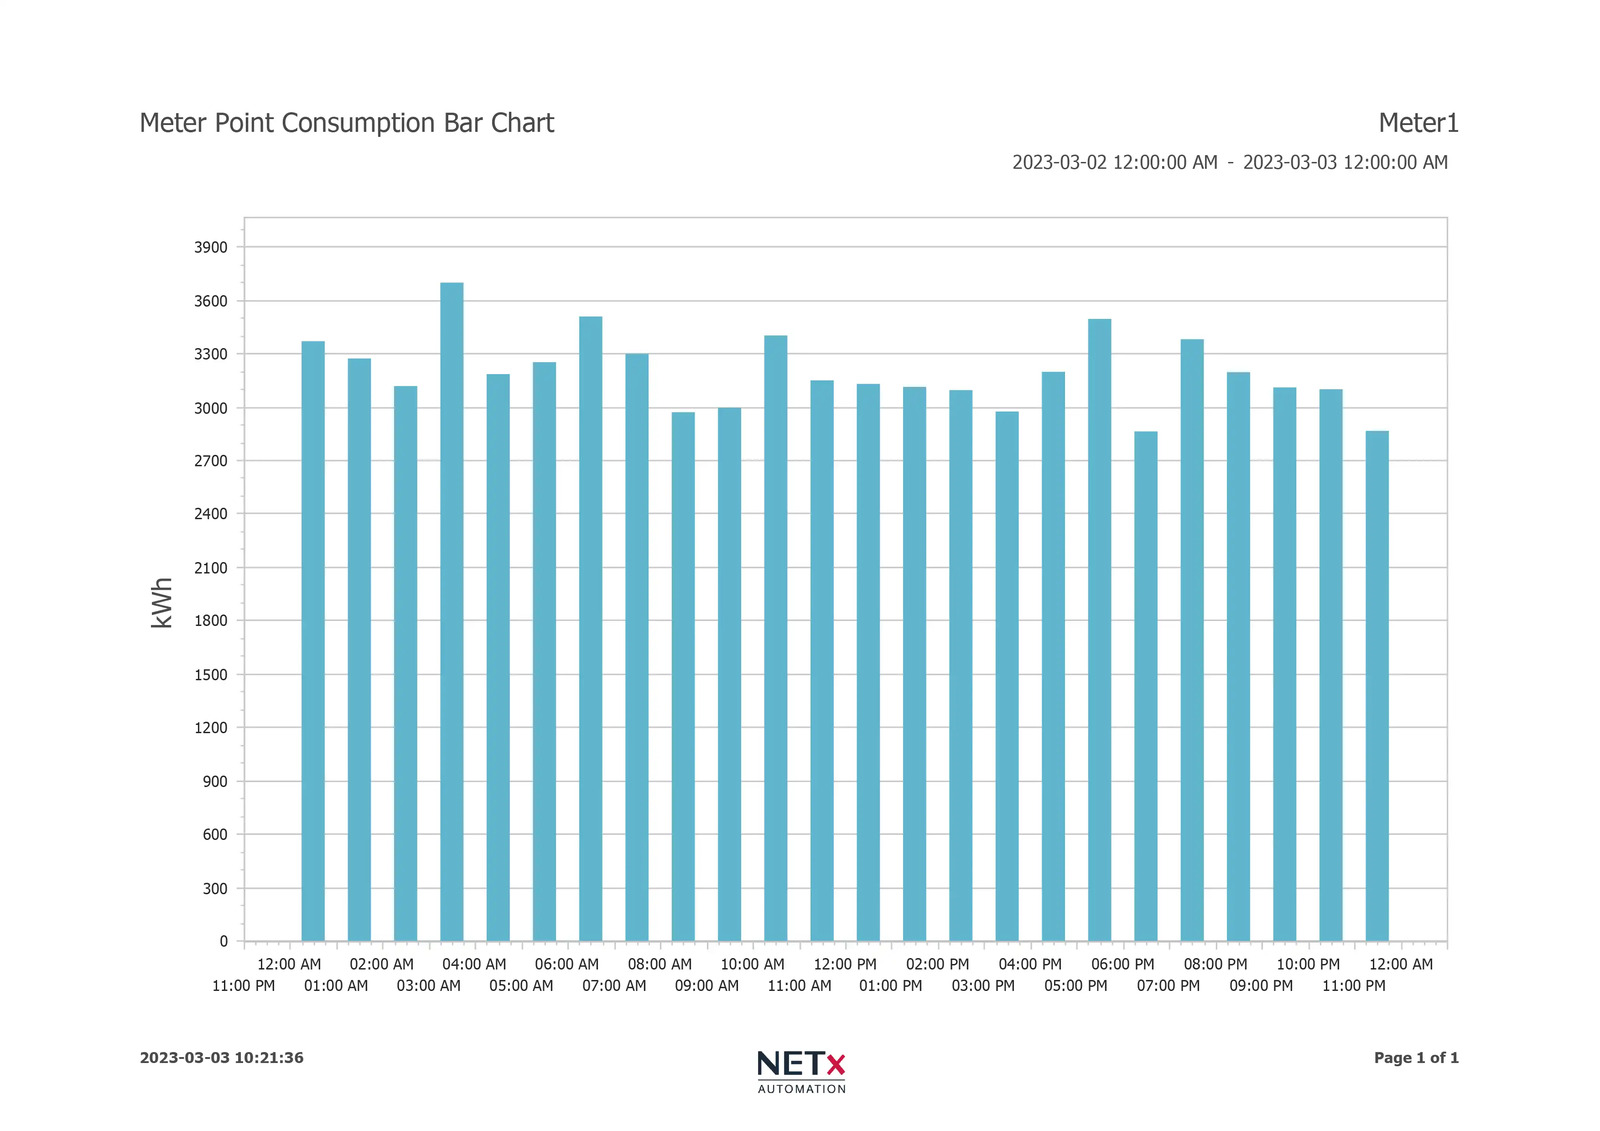
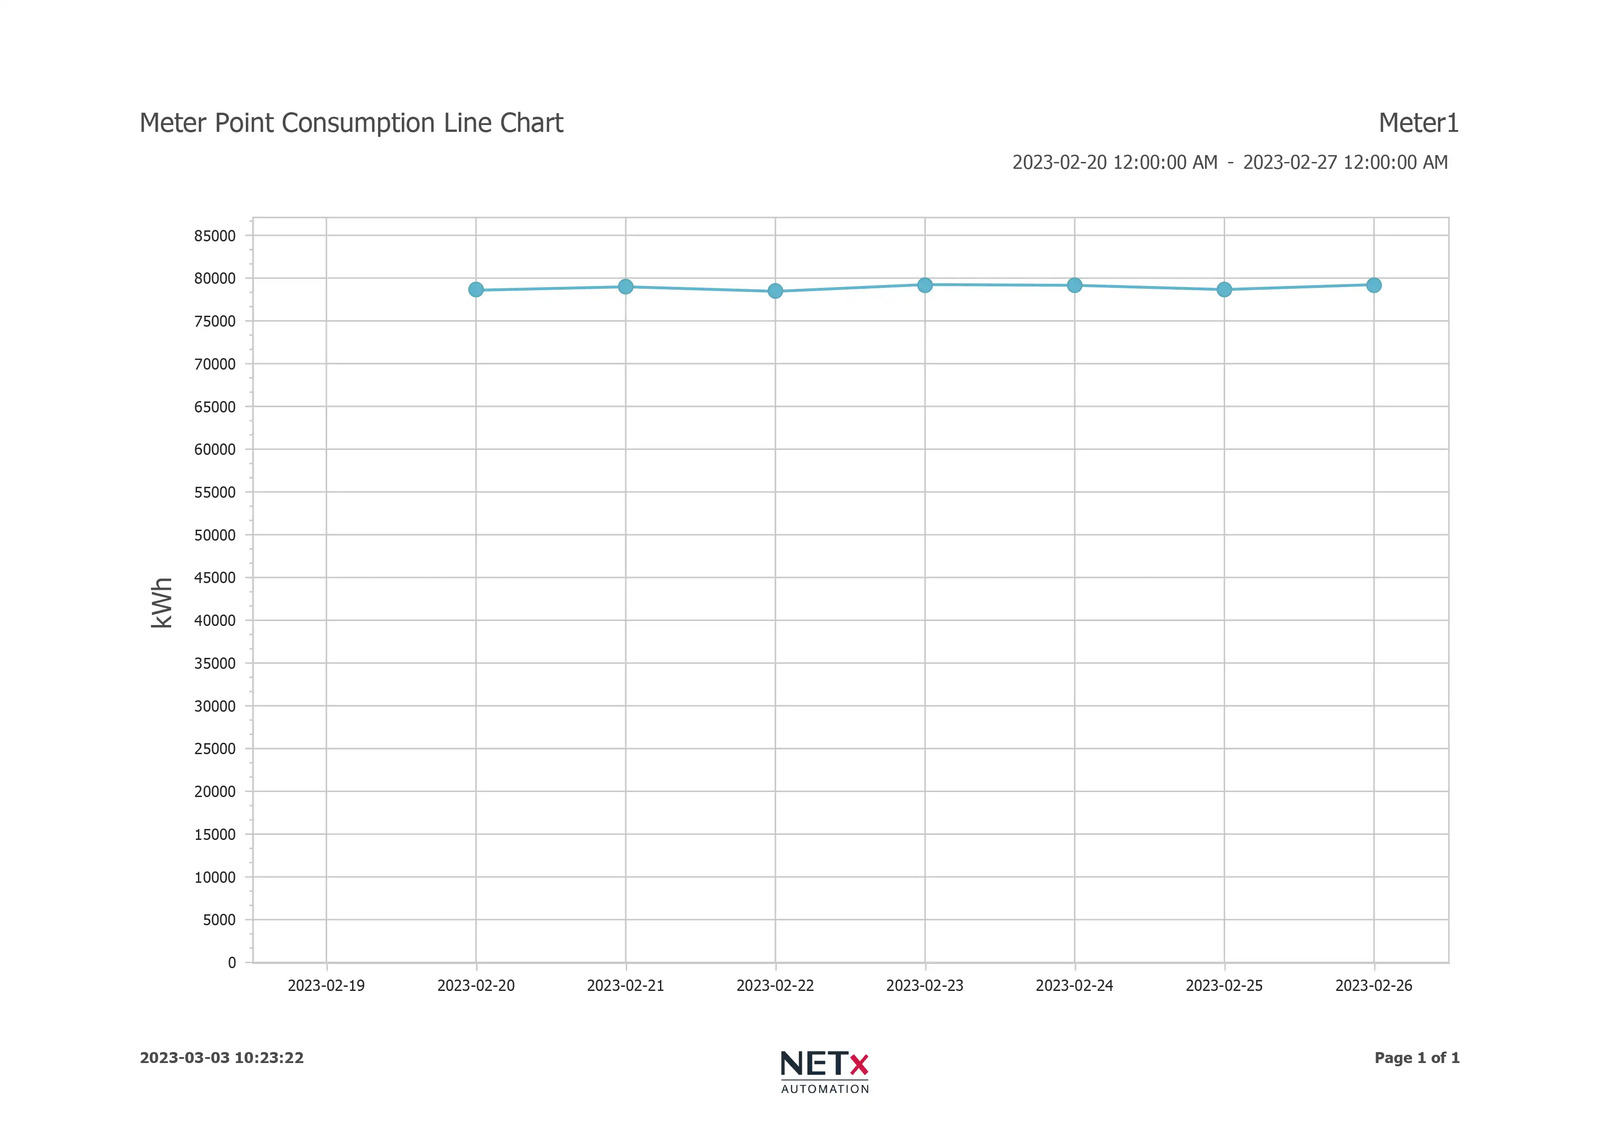
The module enables the display and analysis of consumption values recorded by smart meters, providing clear insights into resource usage.
Resource Management
Resource Management
Continuous monitoring and analysis of consumption data ensure the efficient use of available resources, reducing waste and optimizing operations.
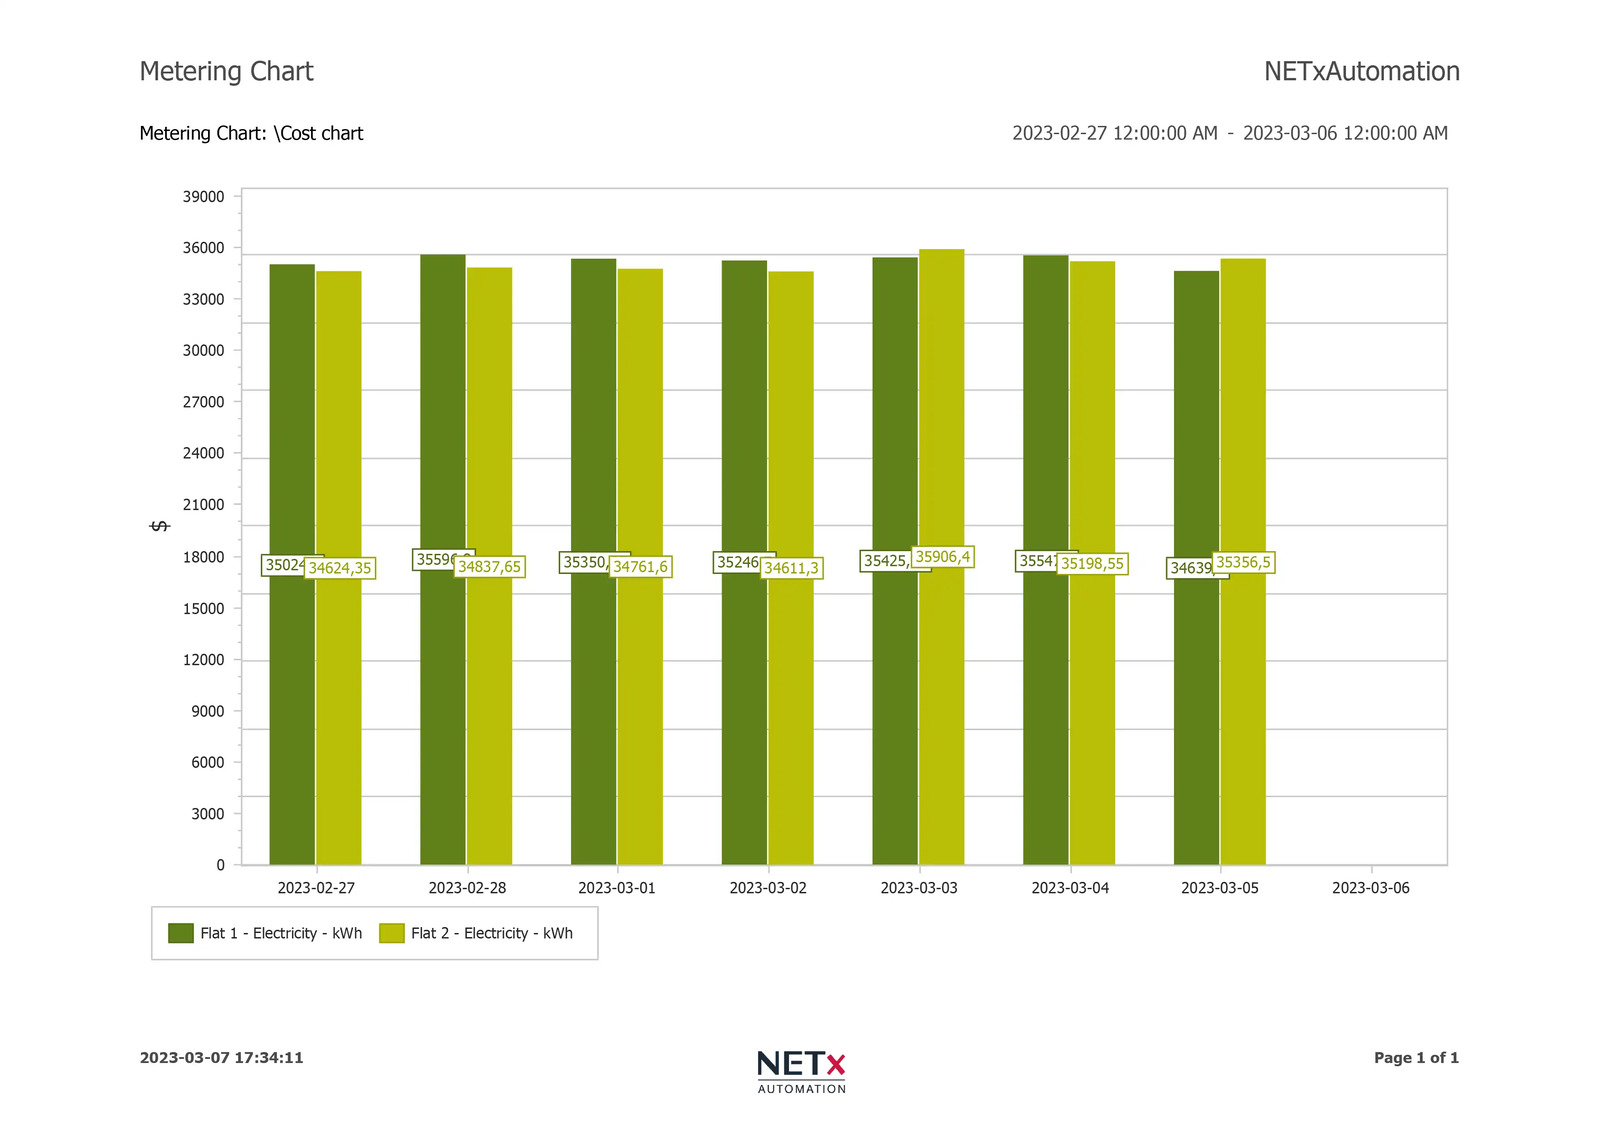
Cost Center Allocation
Cost Center Allocation
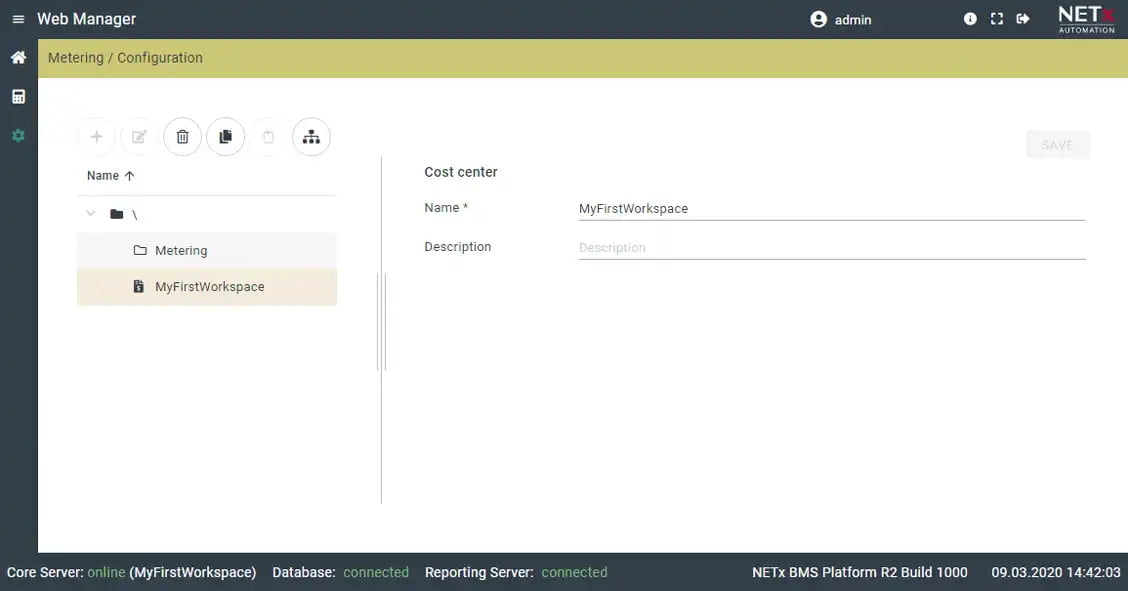
By implementing a cost center structure, consumed resources can be precisely assigned to specific cost centers, facilitating detailed cost calculations.
Open Protocol Support
Open Protocol Support
The Metering Module is fully integrated into the NETx BMS Platform and supports various open protocols and standards for flexible and scalable solution.
Optimized Resource Management with Flexible Integration
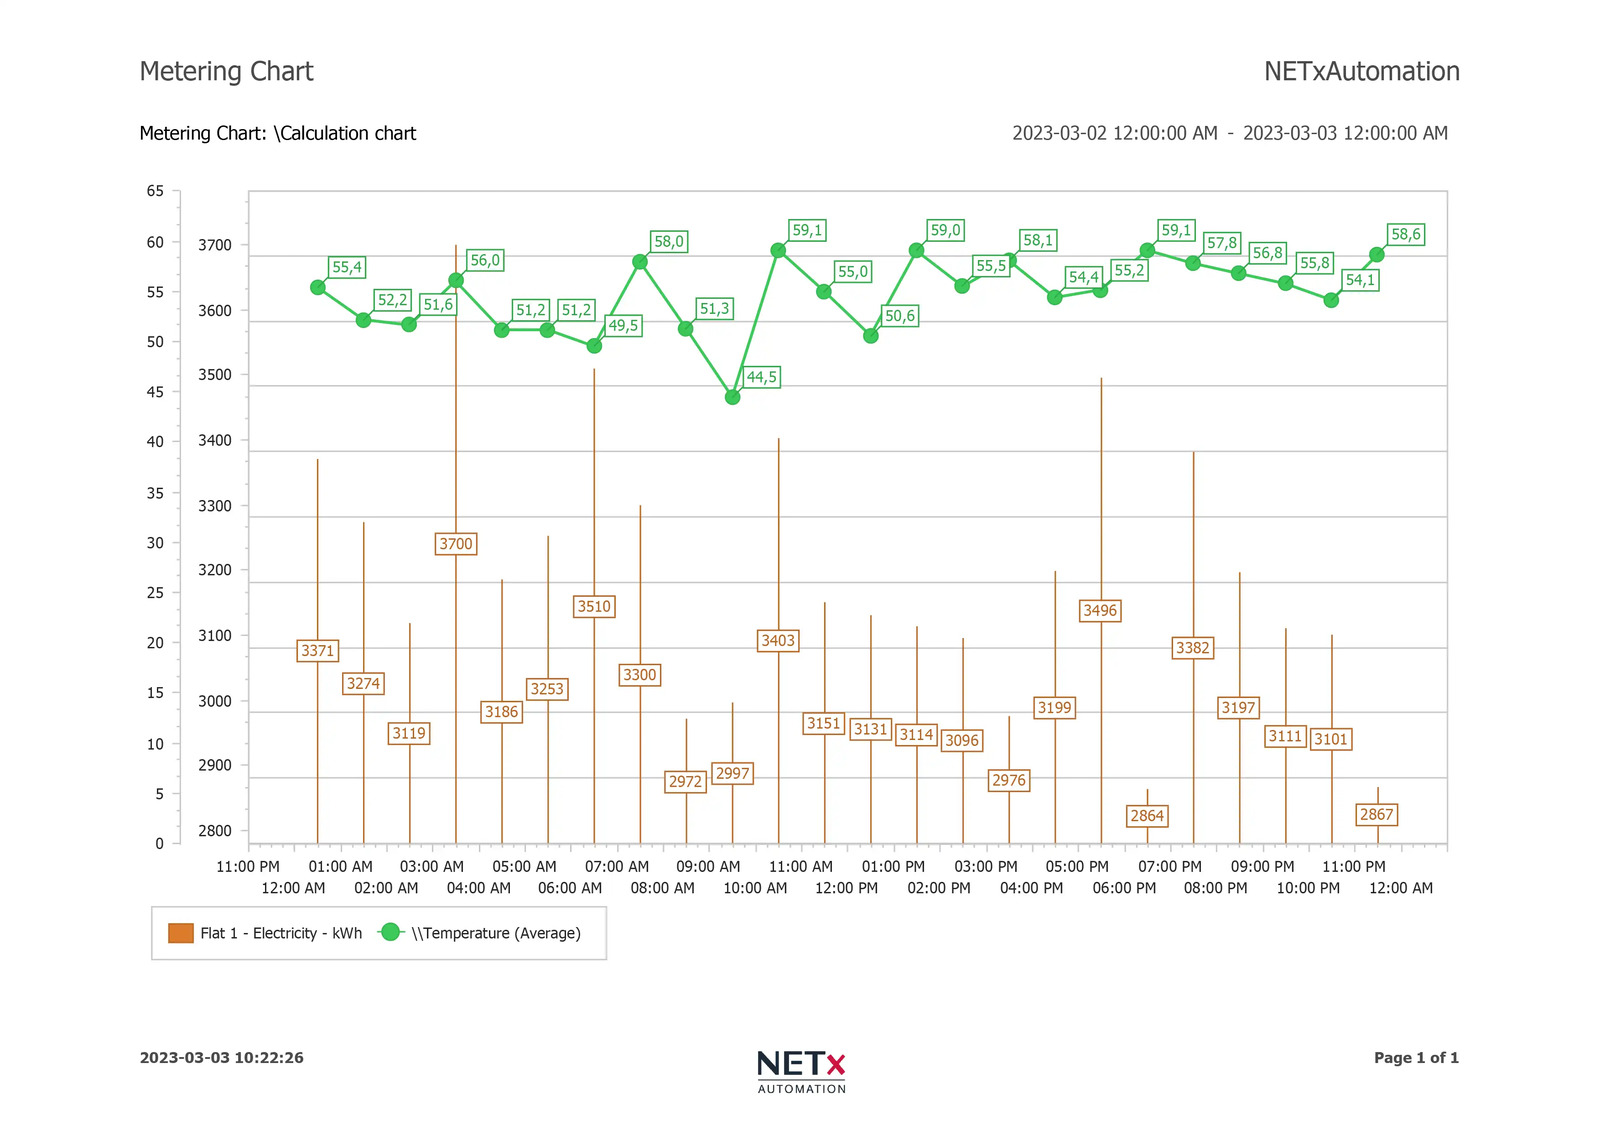
Visualized data for transparent energy and temperature analysis – a powerful solution for efficiency and optimization.
Functions
Functions
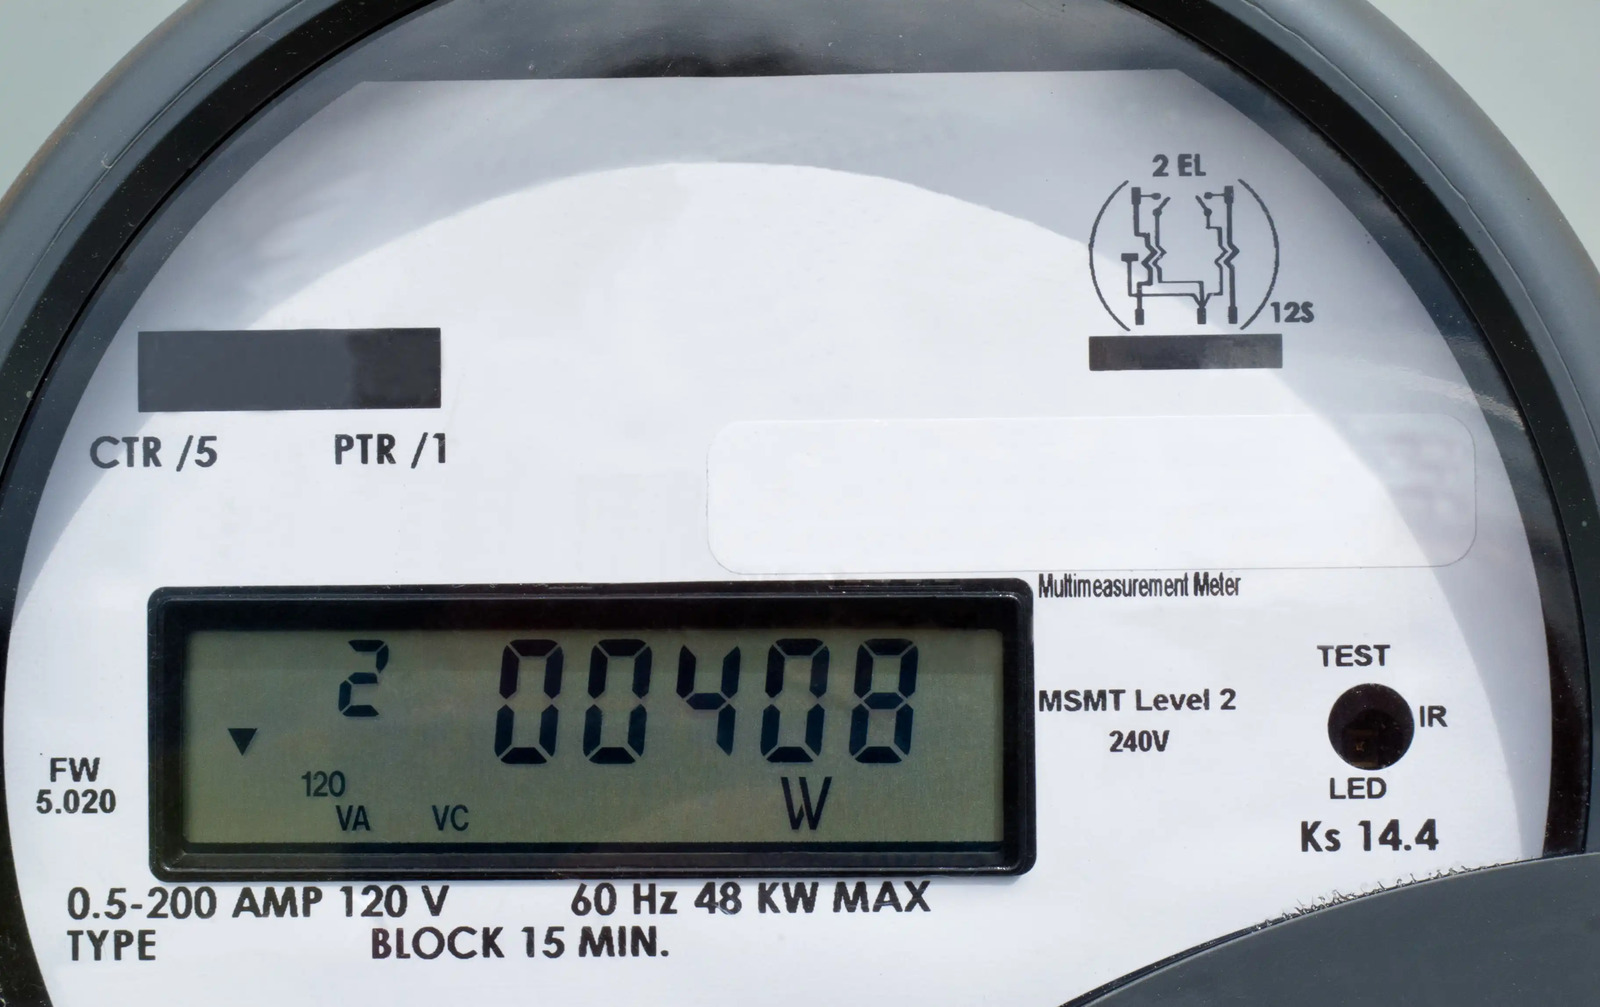
Compatible with various meter types, including KNX, BACnet, Modbus, and M-Bus
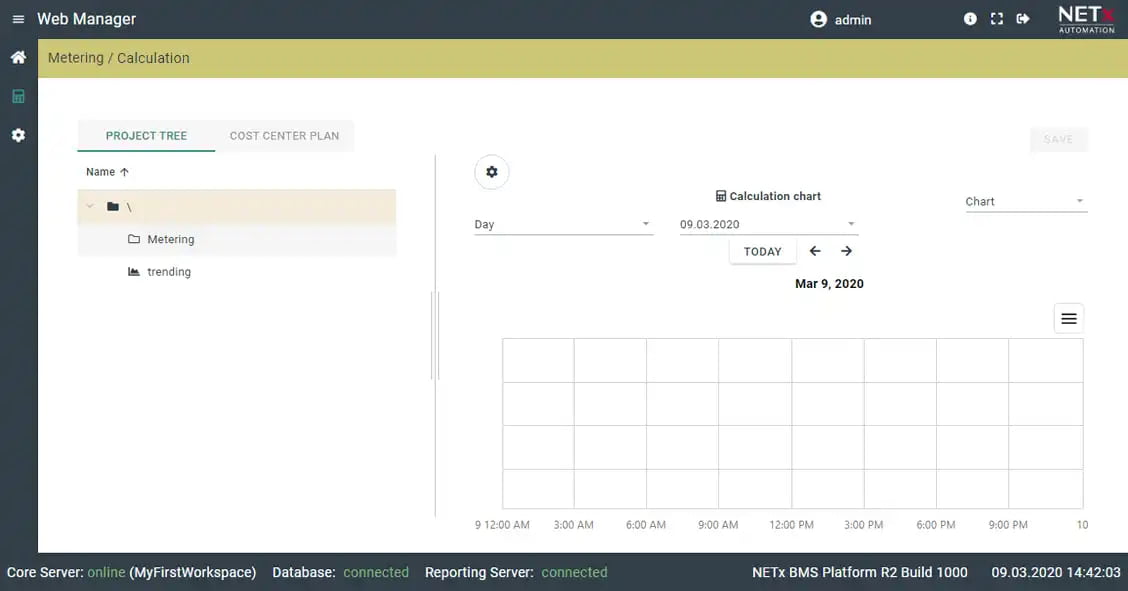
Provides real-time consumption tracking across intervals (hourly to yearly)
Allows for hierarchical structuring with cost center assignments
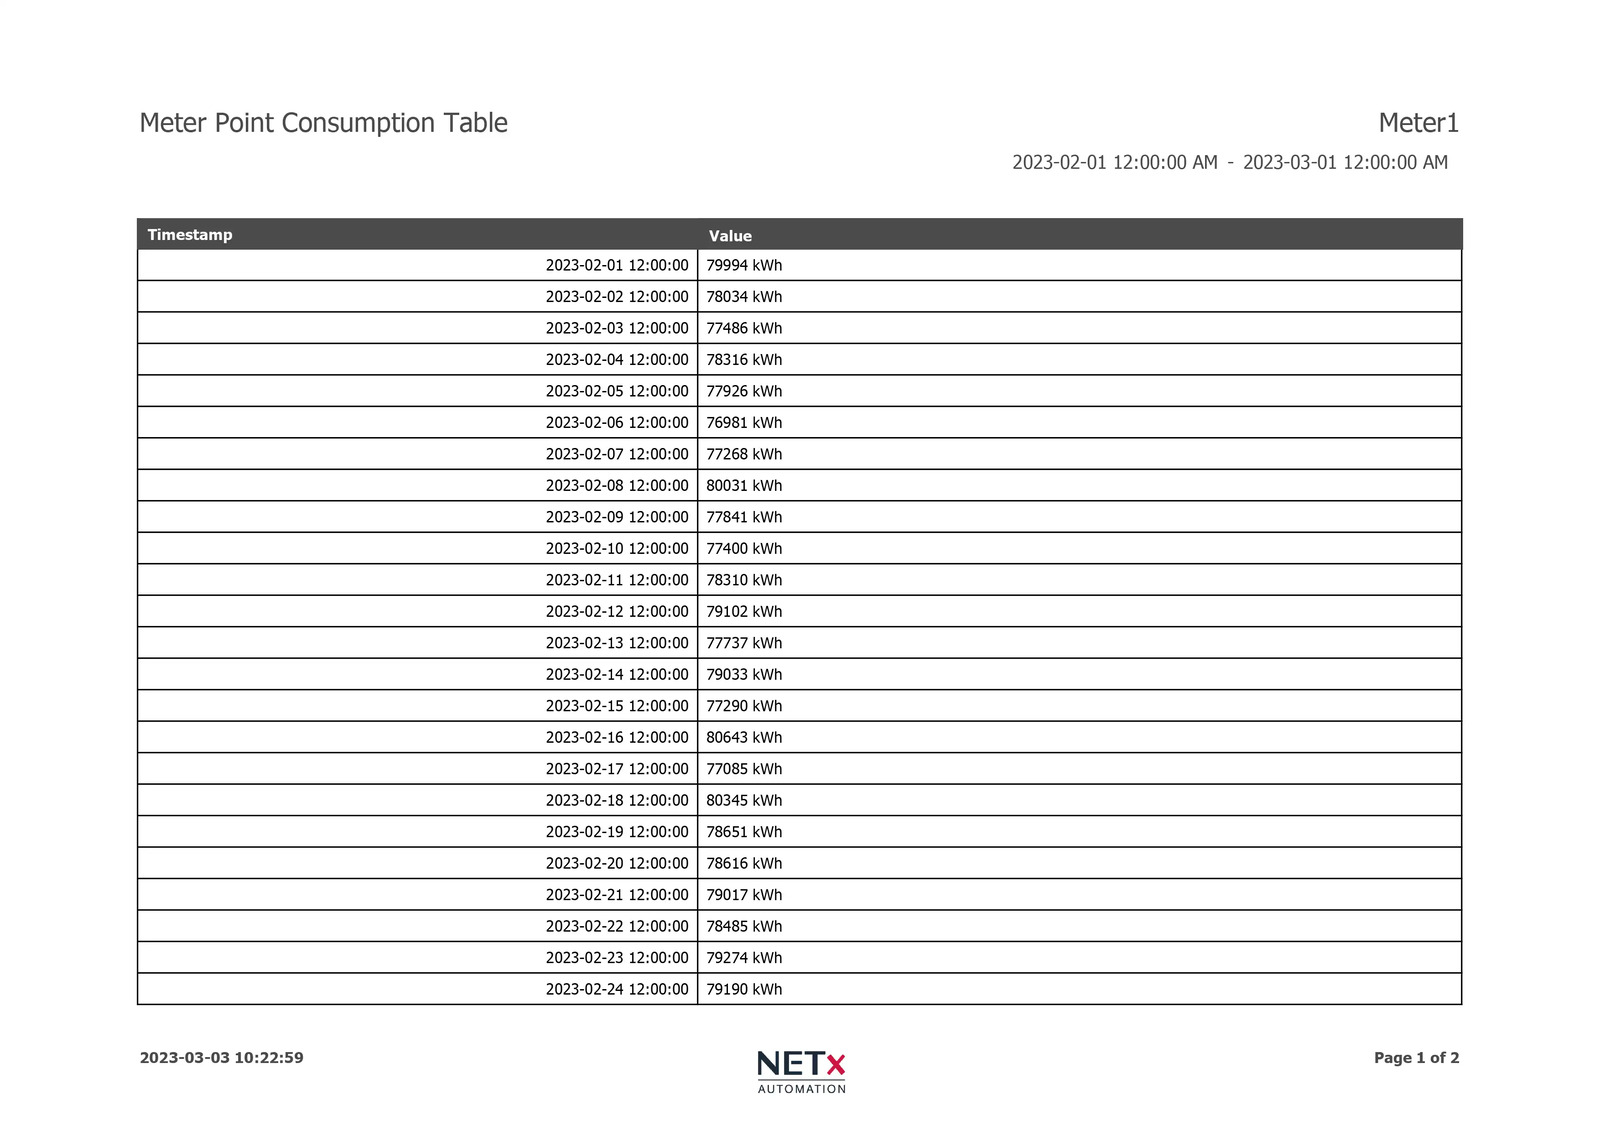
Offers robust reporting with export options to PDF, Excel, and third-party systems
Supports role-based user management for controlled module access
Versatile Options for Report Creation
Versatile Options for Report Creation
- Customizable Reports: Users can utilize standard reports or create custom reports tailored to specific requirements.
- Multiple Output Formats: Consumption data can be exported in various formats, such as PDF or Excel, allowing for flexible post-processing.
- Scheduled Reporting: Reports can be automatically sent via email or exported to other systems on a periodic basis, enabling automated generation and distribution.
 NETx Metering App
NETx Metering App
- Visualization of Meter Readings: The app allows the display of consumption values recorded by configured metering points in real-time or as historical data.
- Data Analysis and Report Creation: Users can perform detailed analyses of consumption data and generate reports to identify trends and savings potential.
- Integration into Building Management: The collected and analyzed data can be used to optimize overall building management, reducing energy consumption and cutting costs.
- Management of Metering Points: The app provides tools for managing and organizing metering points, including the definition of cost allocations and tariffs.
- Integration into Building Management: The collected and analyzed data can be used to optimize overall building management, reducing energy consumption and cutting costs.
Only included in connection with the NETx Metering Module
Technical Details
Technical Details
- Consumption data is available for various intervals: hour, day, week, month, and year.
- Allows real-time analysis of consumption trends across different periods.
- Records maximum and minimum consumption values per period (e.g., max hourly consumption of the day), enabling identification of usage patterns and peak demands.
- Trending: Collects and stores raw data from various resources.
- Resource Type: Defines the resource (e.g., water, electricity) and unit (m³, kWh).
- Cost Rate: Sets pricing per unit (e.g., €/m³) for resource consumption.
- Consumption limits can be set for each time interval (hour, day, week, etc.), with alerts when limits are reached.
- Values reflect whether consumption remains within defined thresholds.
- Stores and allows access to last hour, day, week, month, and year consumption data for trend comparison.